Unlock a world of possibilities! Login now and discover the exclusive benefits awaiting you.
- Qlik Community
- :
- All Forums
- :
- QlikView App Dev
- :
- Re: Chart Help
- Subscribe to RSS Feed
- Mark Topic as New
- Mark Topic as Read
- Float this Topic for Current User
- Bookmark
- Subscribe
- Mute
- Printer Friendly Page
- Mark as New
- Bookmark
- Subscribe
- Mute
- Subscribe to RSS Feed
- Permalink
- Report Inappropriate Content
Chart Help
Hello-
I have two sets of data, joined by a common field (timeOUT) in a chart. The chart is below.
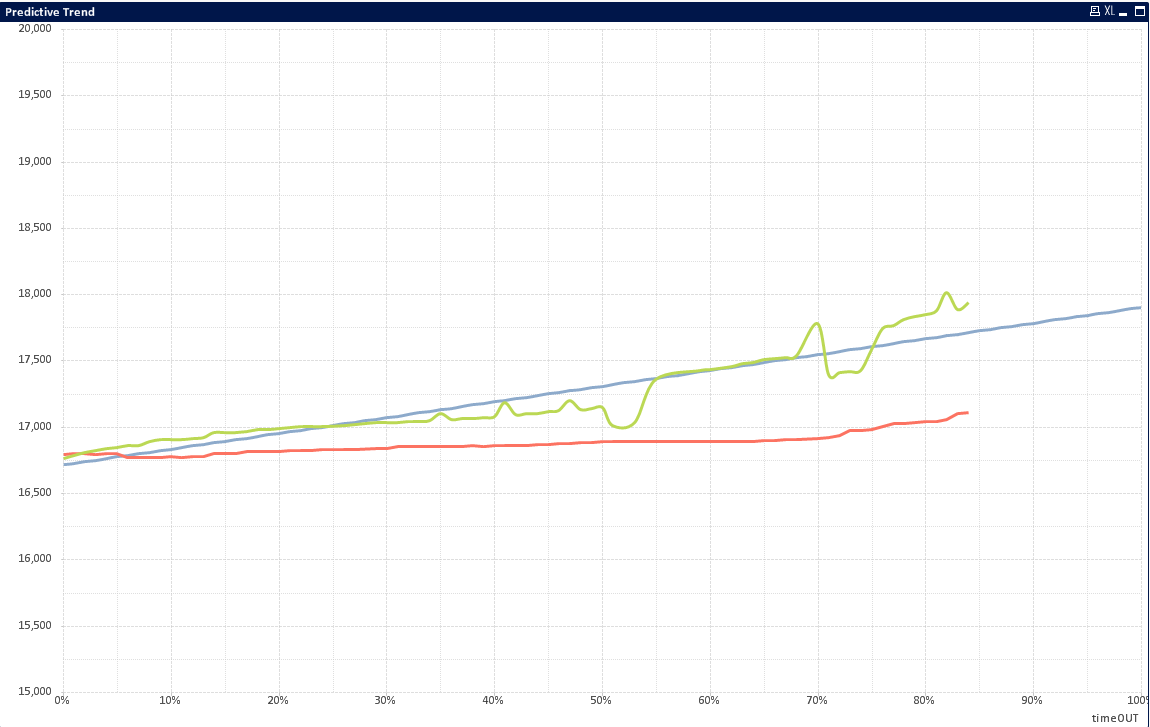
the issue i'm having is that the green line is an average of a field called RunningTotal (so avg(RunningTotal) as the expression), where there is data in the data set from 0 to 100% (so the full axis). The red line, CurrentSales, does not have a full 100% of data. Whenever i chose a type of product, which then shows the data for the CurrentSales of that product, it limits the green line to only show data up to the point of the CurrentSales timeline. Is there a way to ensure that the avg(RunningTotal) aka the green line always goes to 100% Its a predictive line off previous sales, and showing the full trend is the end goal.
- « Previous Replies
-
- 1
- 2
- Next Replies »
- Mark as New
- Bookmark
- Subscribe
- Mute
- Subscribe to RSS Feed
- Permalink
- Report Inappropriate Content
Sure you can 
- « Previous Replies
-
- 1
- 2
- Next Replies »