Unlock a world of possibilities! Login now and discover the exclusive benefits awaiting you.
- Qlik Community
- :
- All Forums
- :
- QlikView App Dev
- :
- Re: Chart Properties
- Subscribe to RSS Feed
- Mark Topic as New
- Mark Topic as Read
- Float this Topic for Current User
- Bookmark
- Subscribe
- Mute
- Printer Friendly Page
- Mark as New
- Bookmark
- Subscribe
- Mute
- Subscribe to RSS Feed
- Permalink
- Report Inappropriate Content
Chart Properties
Hi,
We use a chart to do some analysis on creditors:
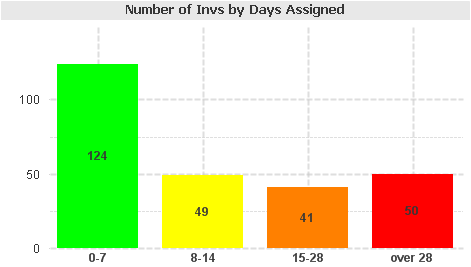
We then sometimes apply filters that will change the numbers, my query is as follows:
Is it possible to format the chart so that 0-7 will always be green 8-14 will always be yellow etc, rather than get a result like below:
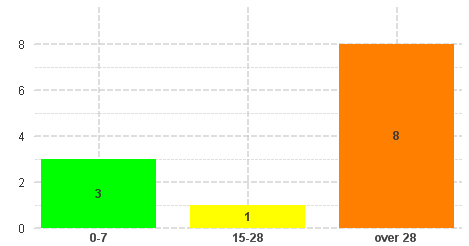
The normal chart properties won't do this as 15-28 won't always be the 3rd 'group'.
Thanks
Anthony
Accepted Solutions
- Mark as New
- Bookmark
- Subscribe
- Mute
- Subscribe to RSS Feed
- Permalink
- Report Inappropriate Content
on the color tab you may get a quick fix by checking 'persistent colors'
- Mark as New
- Bookmark
- Subscribe
- Mute
- Subscribe to RSS Feed
- Permalink
- Report Inappropriate Content
It is possible. How - depends on how the chart is built. If each bar is a separate expression - use attribute expression for background color in each.
- Mark as New
- Bookmark
- Subscribe
- Mute
- Subscribe to RSS Feed
- Permalink
- Report Inappropriate Content
on the color tab you may get a quick fix by checking 'persistent colors'
- Mark as New
- Bookmark
- Subscribe
- Mute
- Subscribe to RSS Feed
- Permalink
- Report Inappropriate Content
Michael,
They aren't seperate expressions unfortunately - built in the script rather that in the chart.
- Mark as New
- Bookmark
- Subscribe
- Mute
- Subscribe to RSS Feed
- Permalink
- Report Inappropriate Content
Jonathan,
This worked thanks - although I did have to change the order of my colours which I thought was strange!
- Mark as New
- Bookmark
- Subscribe
- Mute
- Subscribe to RSS Feed
- Permalink
- Report Inappropriate Content
If it one expression, you can better control colors with a conditional expression for color on the dimension level.