Unlock a world of possibilities! Login now and discover the exclusive benefits awaiting you.
- Qlik Community
- :
- All Forums
- :
- QlikView App Dev
- :
- Chart With Multiple Segments
- Subscribe to RSS Feed
- Mark Topic as New
- Mark Topic as Read
- Float this Topic for Current User
- Bookmark
- Subscribe
- Mute
- Printer Friendly Page
- Mark as New
- Bookmark
- Subscribe
- Mute
- Subscribe to RSS Feed
- Permalink
- Report Inappropriate Content
Chart With Multiple Segments
Trying to create a chart like attached.
It shows Top 10 values and their Total and % then shows Top 25 and their Total and % including Others and overall Total.
Is this achievable in single object?
- Mark as New
- Bookmark
- Subscribe
- Mute
- Subscribe to RSS Feed
- Permalink
- Report Inappropriate Content
Can you try with pivot table ? If not possible, please make the aggregate data and concatenate to your table in the script. can you please post sample data here ?
- Mark as New
- Bookmark
- Subscribe
- Mute
- Subscribe to RSS Feed
- Permalink
- Report Inappropriate Content
Hi,
maybe you could use valuelist to create a faked dimension.
If valuelist()=first value then calculate the top10, =second the top25 and so on
Then you have to sort this values
- Mark as New
- Bookmark
- Subscribe
- Mute
- Subscribe to RSS Feed
- Permalink
- Report Inappropriate Content
I attached an Excel file. Need to show:
Top 10 Total - after first 10 rows
Top 10 % of Total - below "Top 10 Total"
Then, at the bottom (after 25 rows) show:
Top 25 Total
Top 25 % of Total
All others
Overall Total
- Mark as New
- Bookmark
- Subscribe
- Mute
- Subscribe to RSS Feed
- Permalink
- Report Inappropriate Content
Hi,
you could add an inline table
LOAD * INLINE [
F1
DimTop10
Top10
Top10%
DimTop25
Top25
Top25%
];
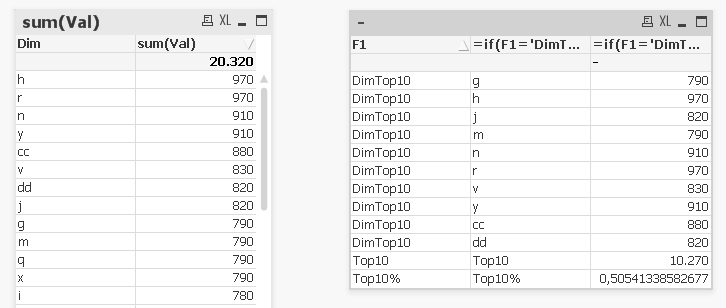
Then in the chart the following dimensions (I worked only for the first part):
"F1" (the field could be hidden)
and
"=if(F1='DimTop10', if(aggr(rank(sum(Val),4,2), Dim)<=10, Dim)
,if(F1='Top10', 'Top10'
,if(F1='Top10%', 'Top10%')
)
)
"
and the following expression
"=if(F1='DimTop10', if(aggr(rank(sum(Val),4,2), Dim)<=10, sum(Val))
,if(F1='Top10', sum({$<Dim={"=rank(sum(Val))<=10"}>} Val)
,if(F1='Top10%', sum({$<Dim={"=rank(sum(Val))<=10"}>} Val) / sum(Val))
)
)
"
- Mark as New
- Bookmark
- Subscribe
- Mute
- Subscribe to RSS Feed
- Permalink
- Report Inappropriate Content
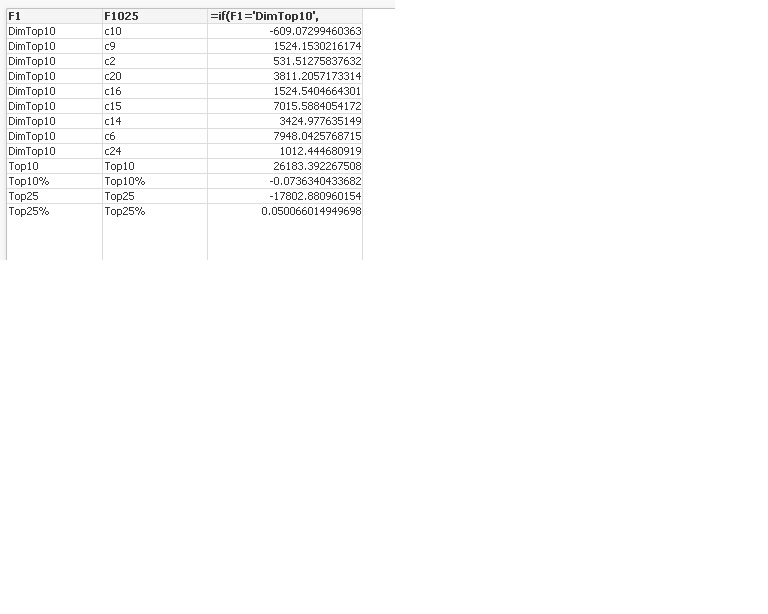
When I tried for Top10 if worked almost fine (except the fact it shows 9 rows in the chart) but Top25 does not work as expected. For Top25, I only see Top25 Total and Top25 % rows but no rows above that for DimTop25.
I'm using:
Dimensions:
F1
and
=if(F1='DimTop10',
if(aggr(rank(sum(Change),4,2), Client)<=10, Client),
if(F1='Top10', 'Top10',
if(F1='Top10%', 'Top10%',
if(F1='DimTop25',
if(aggr(rank(sum(Change),4,2), Client)<=25, Client),
if(F1='Top25', 'Top25',
if(F1='Top25%', 'Top25%'
))))))
Expression:
=if(F1='DimTop10',
if(aggr(rank(sum(Change),4,2), Client)<=10, sum(Change)),
if(F1='Top10', sum({$<Client={"=rank(sum(Change))<=10"}>} Change),
if(F1='Top10%', sum({$<Client={"=rank(sum(Change))<=10"}>} Change) / sum(Change),
if(F1='DimTop25',
if(aggr(rank(sum(Change),4,2), Client)<=25, sum(Change)),
if(F1='Top25', sum({$<Client={"=rank(sum(Change))<=25"}>} Change),
if(F1='Top25%', sum({$<Client={"=rank(sum(Change))<=25"}>} Change) / sum(Change)
))))))
- Mark as New
- Bookmark
- Subscribe
- Mute
- Subscribe to RSS Feed
- Permalink
- Report Inappropriate Content
dathu.qv
I don't think Pivot table does that, I attached some sample data as an Excel in my very first post.
Thank you.
- Mark as New
- Bookmark
- Subscribe
- Mute
- Subscribe to RSS Feed
- Permalink
- Report Inappropriate Content
Hello Arsalan, I am busy with my priorities so my reply got delayed..
Just you make the data into slices and finally concatenate all the slices. You can do all this into script level. Please find the attached qvd for reference. Please let me know in case of any concerns.