Unlock a world of possibilities! Login now and discover the exclusive benefits awaiting you.
- Qlik Community
- :
- All Forums
- :
- QlikView App Dev
- :
- Re: Chart dimension: Not showing all values. Incor...
- Subscribe to RSS Feed
- Mark Topic as New
- Mark Topic as Read
- Float this Topic for Current User
- Bookmark
- Subscribe
- Mute
- Printer Friendly Page
- Mark as New
- Bookmark
- Subscribe
- Mute
- Subscribe to RSS Feed
- Permalink
- Report Inappropriate Content
Chart dimension: Not showing all values. Incorrect scale?
I have a line chart with one dimension and three expressions. Dimension is a date field. The problem is that not all data is being shown in the line chart (not all dates are shown for dimension). Initially I thought that I had a problem loading data so I checked this and it was not the problem. Also in chart properties, within dimensions tab, I tried to check "show all values" option, but this does not affect, it does the same. Also I has tried to uncheck "Supress zero values" from Presentation tab but it does not work.
So after checking many things, I had an idea: In design time, I did line chart wider and I saw that more data was being shown so I think there is a problem with the dimension scale. I suppose QlikView by default uses a scale which only show first X values.
So my question is, Is it possible to make always all values visible in the line chart?
- « Previous Replies
-
- 1
- 2
- Next Replies »
Accepted Solutions
- Mark as New
- Bookmark
- Subscribe
- Mute
- Subscribe to RSS Feed
- Permalink
- Report Inappropriate Content
Have you tried changing the format of Continuous X-axis field to Date?
- Mark as New
- Bookmark
- Subscribe
- Mute
- Subscribe to RSS Feed
- Permalink
- Report Inappropriate Content
I guess if it doesn't fit the screen then you will always have trouble. May be you can try to show Vertical label for Primary Dimensions Labels on the Dimension Axis tab.
Best,
Sunny
- Mark as New
- Bookmark
- Subscribe
- Mute
- Subscribe to RSS Feed
- Permalink
- Report Inappropriate Content
You can enable 'Continuous' axis on axes tab.
- Mark as New
- Bookmark
- Subscribe
- Mute
- Subscribe to RSS Feed
- Permalink
- Report Inappropriate Content
Enabling 'Continuous' shows dates as numbers for dimension....
- Mark as New
- Bookmark
- Subscribe
- Mute
- Subscribe to RSS Feed
- Permalink
- Report Inappropriate Content
Doing this seems to not work.
- Mark as New
- Bookmark
- Subscribe
- Mute
- Subscribe to RSS Feed
- Permalink
- Report Inappropriate Content
Have you tried changing the format of Continuous X-axis field to Date?
- Mark as New
- Bookmark
- Subscribe
- Mute
- Subscribe to RSS Feed
- Permalink
- Report Inappropriate Content
Can you look at my other response below?
- Mark as New
- Bookmark
- Subscribe
- Mute
- Subscribe to RSS Feed
- Permalink
- Report Inappropriate Content
Hi Sunny,
The line chart I have contains 1 dimension and three expressions. Dimension is a date range and the expressions are money type that have one value or another depending on the date so date dimensions is not shown in Numbers tabs as it is not an expression, only expressions appear there. So I cannot change dimension to Date type. I am not sure if I am understanding at all what you are trying to explain me.
- Mark as New
- Bookmark
- Subscribe
- Mute
- Subscribe to RSS Feed
- Permalink
- Report Inappropriate Content
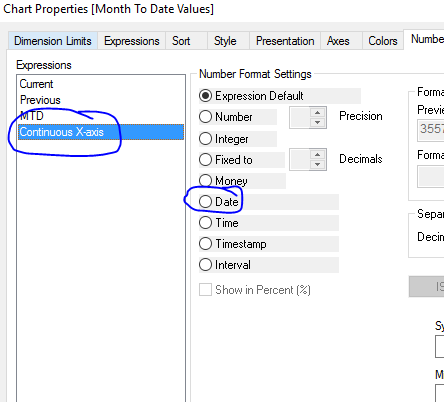
The suggested approach was:
a) Change to 'Continuous' axis on Axes tab
b) Change format of Continuous axis to Date on Number tab (you should see an entry for continuous axis after a) )
If this does not work for you, could you then upload a small sample QVW that demonstrate your issue?
- Mark as New
- Bookmark
- Subscribe
- Mute
- Subscribe to RSS Feed
- Permalink
- Report Inappropriate Content
Hi Stefan,
I saw your method, it works for me and thanks so much!
But I met another problem, if I use Continuous and change it to Date, the dimension label will be wrong.
It will show the Continuous X-axis label, not show my dimension label.
is there any method to solve that?
Thanks.
Aiolos Zhao
- « Previous Replies
-
- 1
- 2
- Next Replies »