Unlock a world of possibilities! Login now and discover the exclusive benefits awaiting you.
- Qlik Community
- :
- All Forums
- :
- QlikView App Dev
- :
- Chart expression help
- Subscribe to RSS Feed
- Mark Topic as New
- Mark Topic as Read
- Float this Topic for Current User
- Bookmark
- Subscribe
- Mute
- Printer Friendly Page
- Mark as New
- Bookmark
- Subscribe
- Mute
- Subscribe to RSS Feed
- Permalink
- Report Inappropriate Content
Chart expression help
Hi Experts,
I have a combo chart with 2 expression.
Expression- 1:- Sum of Sales Units
Expression -2:- Sum of Sales Units from the current month to rolling 12 months. For eg; For Jan'18, sales units is 10 units which is represented in the bar. For the same month Jan'18, the line graph should show total sales units as 2902 units (which is the sum from Jan'18 to Dec'18). For Feb the expression 2 should show from Feb'18 to Jan'18 which would be 3125 units and so on.
The trend line should always be static for 12 months and should not change regardless of selection in month which I will have as a saperate list box.
For eg- The current trend line does the sum of sales for 12 months when there are no filters applied. If I want to view just 4 months of data the trend line should still show the same 12 months sum and not change for just 4 months.
I need help with the expression 2 please.
Appreciate your help.
- « Previous Replies
-
- 1
- 2
- Next Replies »
Accepted Solutions
- Mark as New
- Bookmark
- Subscribe
- Mute
- Subscribe to RSS Feed
- Permalink
- Report Inappropriate Content
Then I guess it is a QlikView version issue... can you upgrade your QlikView version to a more recent version?
- Mark as New
- Bookmark
- Subscribe
- Mute
- Subscribe to RSS Feed
- Permalink
- Report Inappropriate Content
Maybe this:
=RangeSum(Below(Sum({1}[Sales Units]), 0, 12))
hope this helps
- Mark as New
- Bookmark
- Subscribe
- Mute
- Subscribe to RSS Feed
- Permalink
- Report Inappropriate Content
Or one of theses
=RangeSum(Below(Sum({<Date>}[Sales Units]), 0, 12)) * Avg(1)
or
=RangeSum(Below(Sum({<Date>}[Sales Units]), 0, 12))
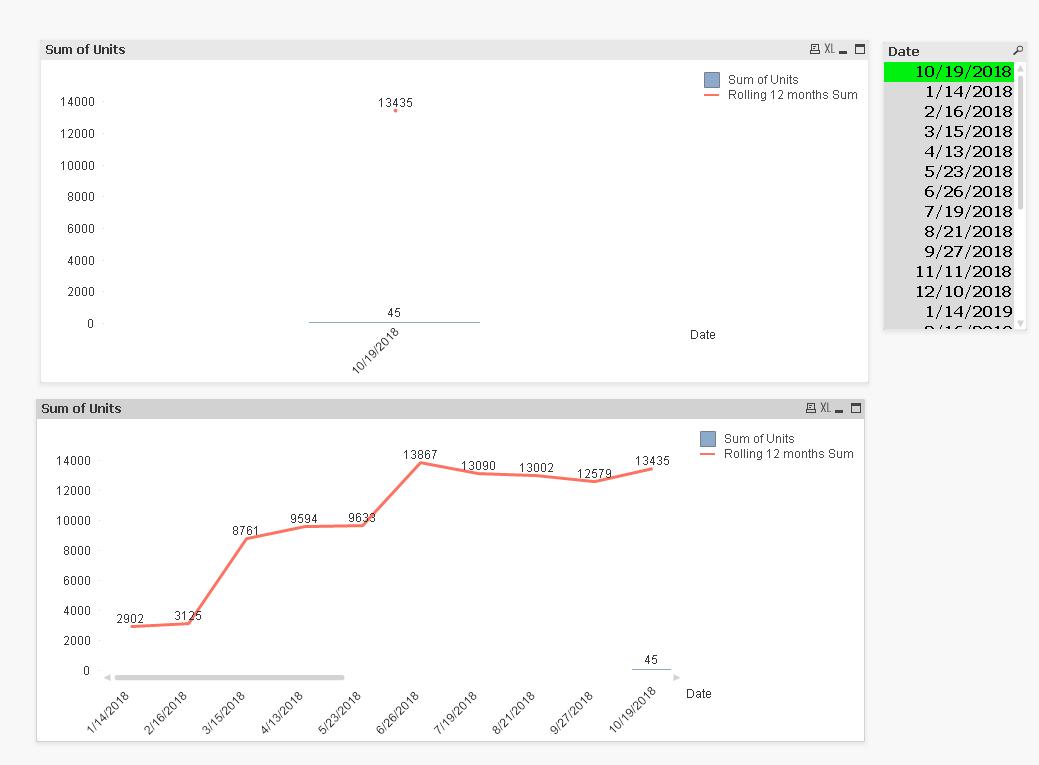
Top chart uses the 1st expression where the accumulation is based on 12 months, but it show only the selected Month's 12 month accumulation. Whereas the second expression shows everything regardless of the selection in Date field.
- Mark as New
- Bookmark
- Subscribe
- Mute
- Subscribe to RSS Feed
- Permalink
- Report Inappropriate Content
HI Frank,
Thanks for the reply.
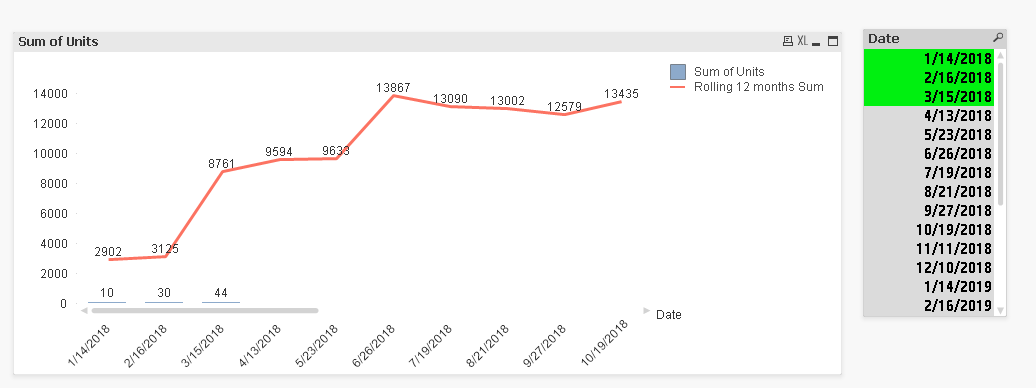
Have one more request on this outcome.. For Eg ; When I select 3 months in Month List box, I need to see the Line only for 3 months as well... instead of seeing it for all the months.. How do we get that ?
- Mark as New
- Bookmark
- Subscribe
- Mute
- Subscribe to RSS Feed
- Permalink
- Report Inappropriate Content
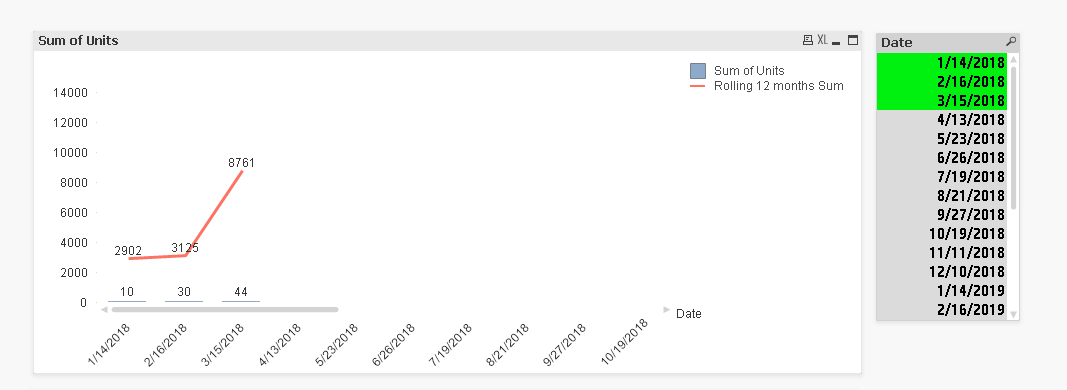
Try this
=RangeSum(Below(Sum({<Date>}[Sales Units]), 0, 12)) * Avg(1)
- Mark as New
- Bookmark
- Subscribe
- Mute
- Subscribe to RSS Feed
- Permalink
- Report Inappropriate Content
Looks good Sunny.
But have an issue.. when I select 3 months.. I see other months as blanks as well apart from the ones that I have selected.. How to overcome this ?
I have used this formulae..
=RangeSum(Below(Sum({<Date>}[Sales Units]), 0, 12)) * Avg(1)
- Mark as New
- Bookmark
- Subscribe
- Mute
- Subscribe to RSS Feed
- Permalink
- Report Inappropriate Content
Can you check 'Suppress Zero Values' on the presentation tab?
- Mark as New
- Bookmark
- Subscribe
- Mute
- Subscribe to RSS Feed
- Permalink
- Report Inappropriate Content
Yes.. it is checked in presentation tab.. And in dimensions aswell..
- Mark as New
- Bookmark
- Subscribe
- Mute
- Subscribe to RSS Feed
- Permalink
- Report Inappropriate Content
Then I guess it is a QlikView version issue... can you upgrade your QlikView version to a more recent version?
- Mark as New
- Bookmark
- Subscribe
- Mute
- Subscribe to RSS Feed
- Permalink
- Report Inappropriate Content
OK Cool... Thanks!
- « Previous Replies
-
- 1
- 2
- Next Replies »