Unlock a world of possibilities! Login now and discover the exclusive benefits awaiting you.
- Qlik Community
- :
- All Forums
- :
- QlikView App Dev
- :
- Re: Chart is not ignoring selection
- Subscribe to RSS Feed
- Mark Topic as New
- Mark Topic as Read
- Float this Topic for Current User
- Bookmark
- Subscribe
- Mute
- Printer Friendly Page
- Mark as New
- Bookmark
- Subscribe
- Mute
- Subscribe to RSS Feed
- Permalink
- Report Inappropriate Content
Chart is not ignoring selection
Hello 
I have a qlik dashboard where i have the following data:
Client Unit Value Year
1 A 30 2016
1 B 30 2016
1 C 10 2016
2 A 10 2016
2 B 15 2016
2 C 25 2016
3 A 25 2016
3 B 25 2016
3 C 15 2016
1 A 40 2015
1 B 40 2015
1 C 20 2015
...
I want to have a chart displaying: for each client, the unit with the greatest value (and respective value), per year.
The expression I'm using is:
if(aggr(rank(Max({<[Flag_doesn't_matter]={T}>}Value))<=1,[Client],Year,[Unit]),
sum({<[Flag_doesn't_matter={T}>}Value))
and my dimensions are: Client, Year, Unit.
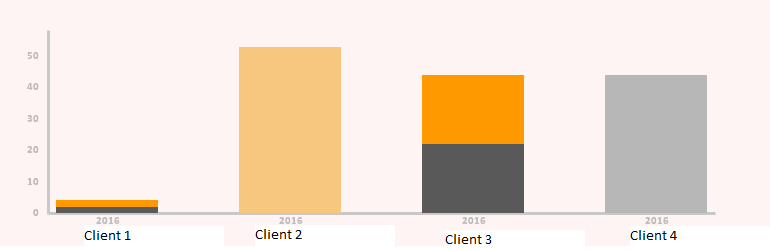
However, my chart shows as follows, which means, it does not consider all years if i don't have all the years selected. At the moment, only 2016 is selected.
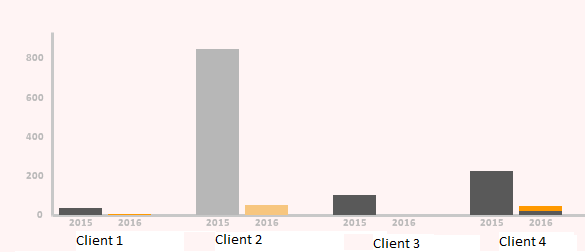
If I select 2015 and 2016, it shows as follows (this is what i want, even having only 2016 selected - I want ALL years):
I don't know how to make the chart to show all years. Thanks in advance.
- Tags:
- bar chart
- « Previous Replies
-
- 1
- 2
- Next Replies »
- Mark as New
- Bookmark
- Subscribe
- Mute
- Subscribe to RSS Feed
- Permalink
- Report Inappropriate Content
Try this:
If(Only({<Year>}Aggr(Rank(Max({<[Flag_doesnt_matter]={T}, Year>}Value))<=1,[Client],Year,[Unit])),
Sum({<[Flag_doesnt_matter]={T}, Year>}Value))
This will ignore any selections in Year field
- Mark as New
- Bookmark
- Subscribe
- Mute
- Subscribe to RSS Feed
- Permalink
- Report Inappropriate Content
It works! Great! Thank you so much (again)
- Mark as New
- Bookmark
- Subscribe
- Mute
- Subscribe to RSS Feed
- Permalink
- Report Inappropriate Content
Only for learning purposes, what's the difference between writing
If(Only({<Year>}Aggr(Rank(Max({<[Flag_doesnt_matter]={T}, Year>}Value))<=1,[Client],Year,[Unit])),
Sum({<[Flag_doesnt_matter]={T}, Year>}Value))
and
If(Only({<Year=>}Aggr(Rank(Max({<[Flag_doesnt_matter]={T}, Year>}Value))<=1,[Client],Year,[Unit])),
Sum({<[Flag_doesnt_matter]={T}, Year=>}Value))
- Mark as New
- Bookmark
- Subscribe
- Mute
- Subscribe to RSS Feed
- Permalink
- Report Inappropriate Content
None whatsoever. Means the same thing
- Mark as New
- Bookmark
- Subscribe
- Mute
- Subscribe to RSS Feed
- Permalink
- Report Inappropriate Content
Thanks!
- Mark as New
- Bookmark
- Subscribe
- Mute
- Subscribe to RSS Feed
- Permalink
- Report Inappropriate Content
- Mark as New
- Bookmark
- Subscribe
- Mute
- Subscribe to RSS Feed
- Permalink
- Report Inappropriate Content
No problem. I am glad I was able to help
- « Previous Replies
-
- 1
- 2
- Next Replies »