Unlock a world of possibilities! Login now and discover the exclusive benefits awaiting you.
- Qlik Community
- :
- All Forums
- :
- QlikView App Dev
- :
- Chart missing dimensions
- Subscribe to RSS Feed
- Mark Topic as New
- Mark Topic as Read
- Float this Topic for Current User
- Bookmark
- Subscribe
- Mute
- Printer Friendly Page
- Mark as New
- Bookmark
- Subscribe
- Mute
- Subscribe to RSS Feed
- Permalink
- Report Inappropriate Content
Chart missing dimensions
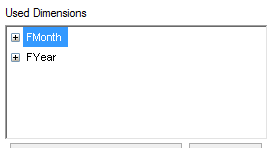
I have created a chart with the following dimensions:

The expression for the chart is as follows:

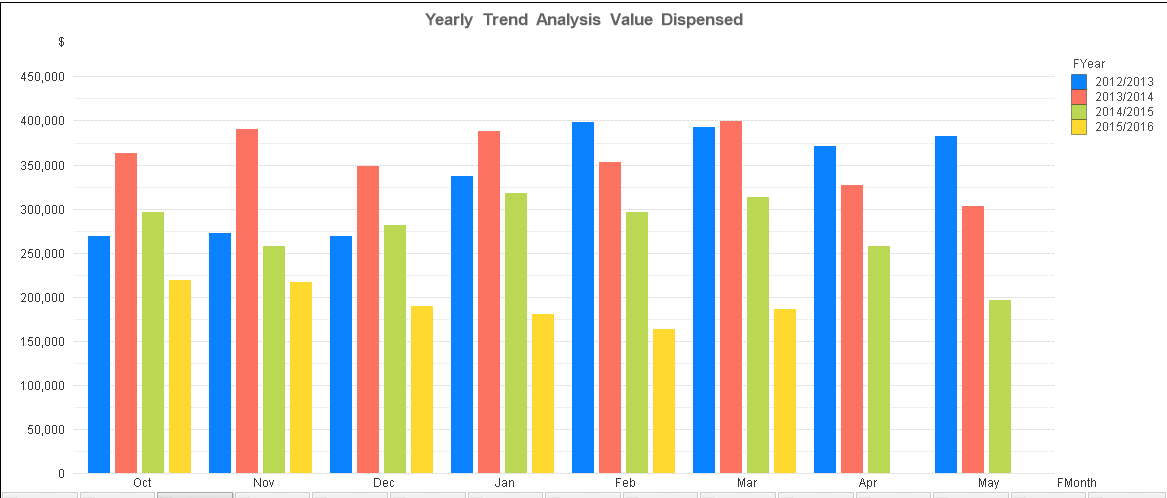
The resulting chart is.below. The chart is not showing the months June, July, August and September. What could be wrong?

Accepted Solutions
- Mark as New
- Bookmark
- Subscribe
- Mute
- Subscribe to RSS Feed
- Permalink
- Report Inappropriate Content
What if you remove the MonthsAgoYTD set analysis and use FMonth and FYear. Does that bring back those months? Just trying to check where might the issue be.
- Mark as New
- Bookmark
- Subscribe
- Mute
- Subscribe to RSS Feed
- Permalink
- Report Inappropriate Content
May be you don't have amount for this Months or it is zero.
- Mark as New
- Bookmark
- Subscribe
- Mute
- Subscribe to RSS Feed
- Permalink
- Report Inappropriate Content
hi,
This is the reason because you dont have data for those months(FMonth).
If you want to achieve the same you need to built master calendar.
or
Do inline
Just add this script have same field name
Load * Inline [
FMonth,Num
Jan,1
Feb,2
Mar,3
Apr,4
May,5
Jun,6
Jul,7
Aug,8
Sept,9
Oct,10
Nov,11
Dec,12
];
- Mark as New
- Bookmark
- Subscribe
- Mute
- Subscribe to RSS Feed
- Permalink
- Report Inappropriate Content
On the similar lines, may be try unchecking 'Suppress-Zero Values' option to see if those months come up with 0 value
- Mark as New
- Bookmark
- Subscribe
- Mute
- Subscribe to RSS Feed
- Permalink
- Report Inappropriate Content
Thanks Kushal
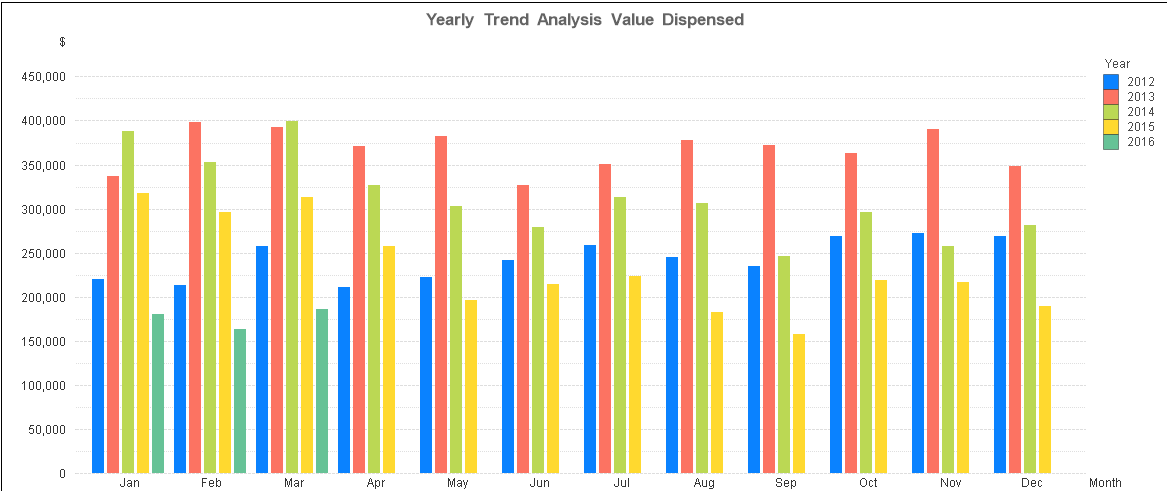
You are right there is something wrong with the expression and fiscal years. I changed the dimensions to calendar month and calendar year and expression to 'Sum(Amount)' and i get the following:

All months are represented so it is something to do with the fiscal calendar in my opinion.
- Mark as New
- Bookmark
- Subscribe
- Mute
- Subscribe to RSS Feed
- Permalink
- Report Inappropriate Content
Many thanks Saumya, see my response to Kushal above.
- Mark as New
- Bookmark
- Subscribe
- Mute
- Subscribe to RSS Feed
- Permalink
- Report Inappropriate Content
What if you remove the MonthsAgoYTD set analysis and use FMonth and FYear. Does that bring back those months? Just trying to check where might the issue be.
- Mark as New
- Bookmark
- Subscribe
- Mute
- Subscribe to RSS Feed
- Permalink
- Report Inappropriate Content
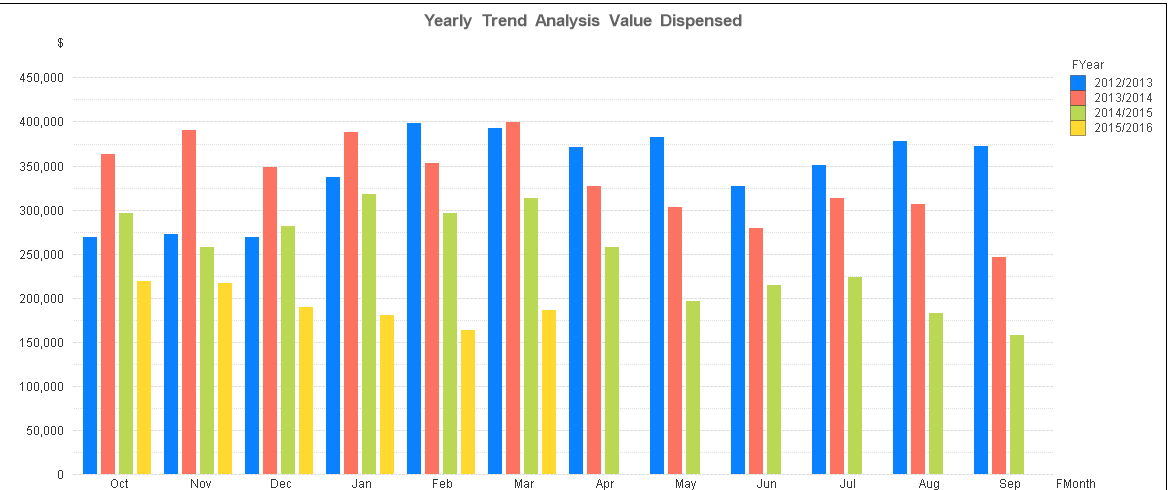
You are right Sunny, i removed the expression with MonthsAgoYTD and replace with ordinary Sum(Amount) and this give the right chart.
