Unlock a world of possibilities! Login now and discover the exclusive benefits awaiting you.
- Qlik Community
- :
- All Forums
- :
- QlikView App Dev
- :
- Re: Chart not responding to selection in the List ...
- Subscribe to RSS Feed
- Mark Topic as New
- Mark Topic as Read
- Float this Topic for Current User
- Bookmark
- Subscribe
- Mute
- Printer Friendly Page
- Mark as New
- Bookmark
- Subscribe
- Mute
- Subscribe to RSS Feed
- Permalink
- Report Inappropriate Content
Chart not responding to selection in the List box
I've created a chart., that needs to plot some measures over different months, based upon a selection made in a list box, both of which are in the same alternate state - Pressure zone.
The list box, lists different pressure zones, and the chart needs to show the values of Ph and Chlorine Levels in the selected Pressure zone, over different months.
Can someone please help me understand why the chart isn't responding to the selection(S) in the list box?
Screenshots:
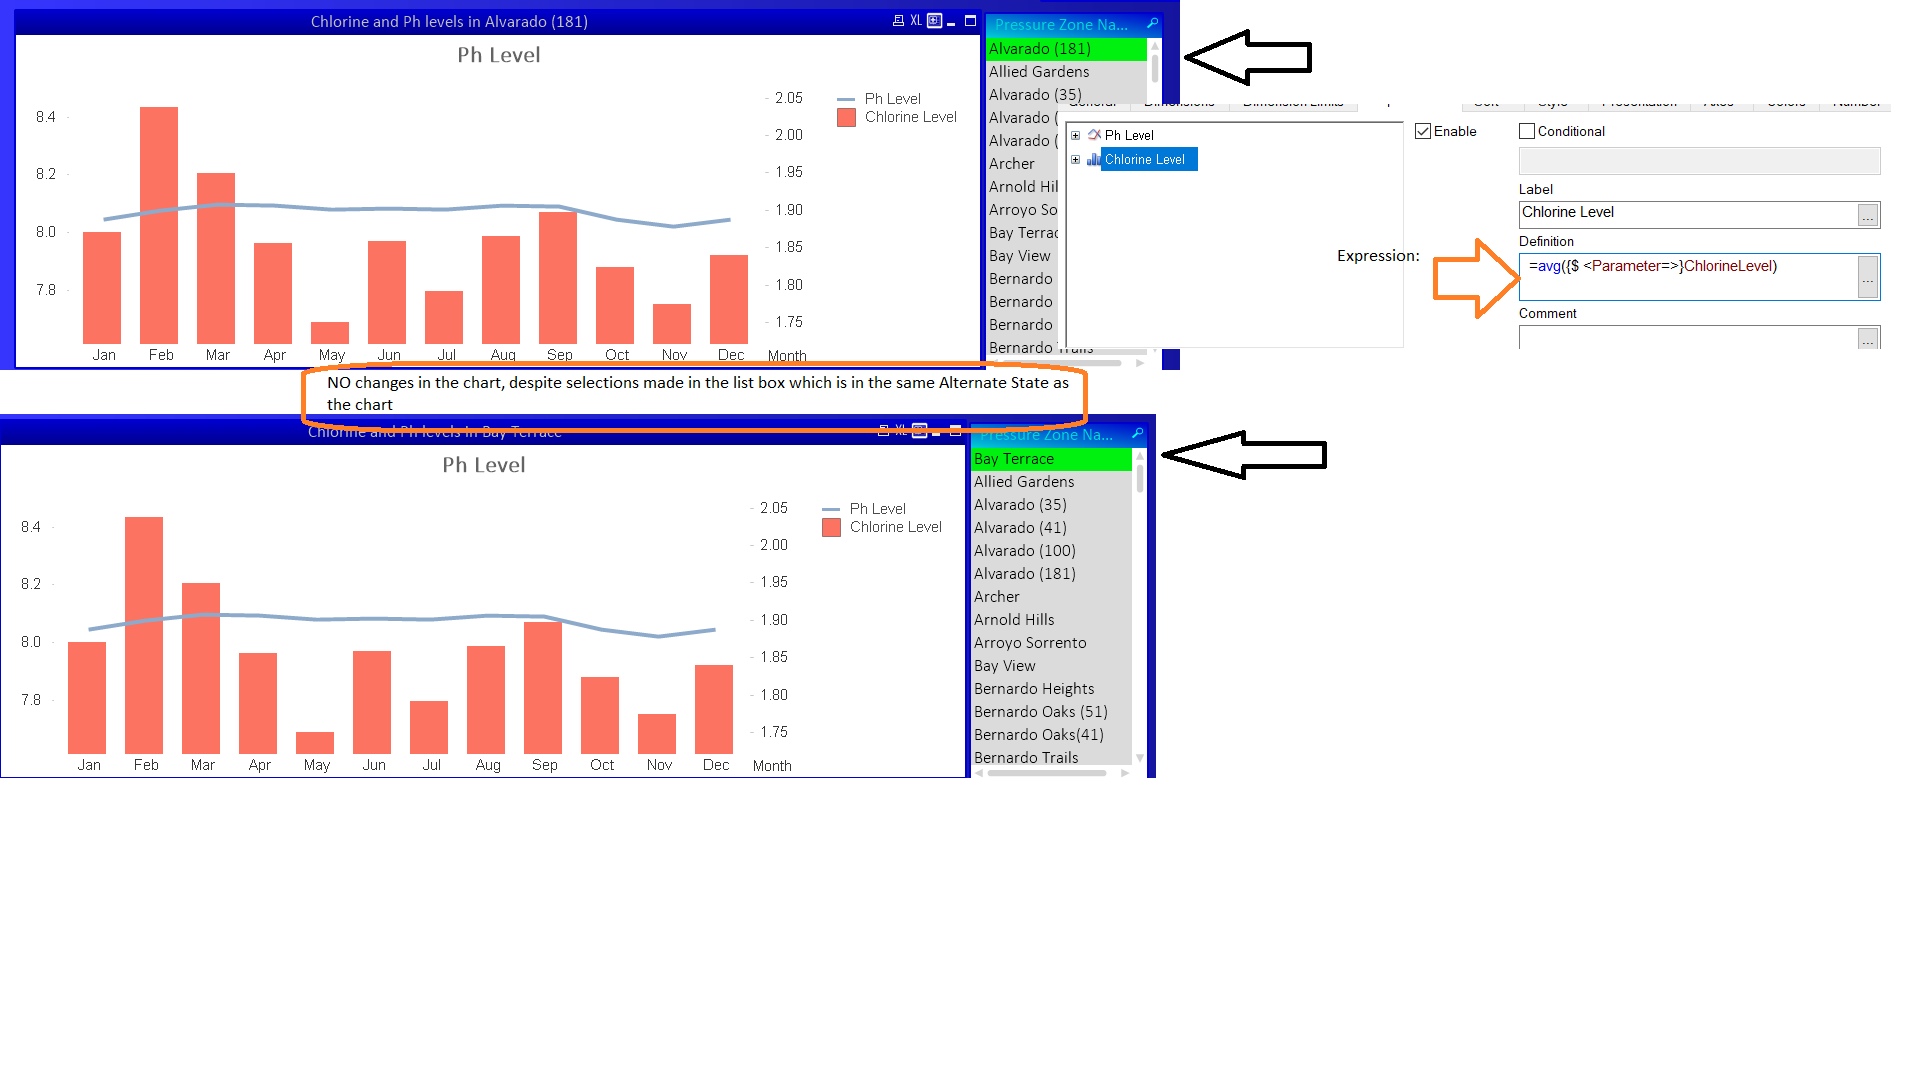
The chart stays the same despite different selection made in the pressure zone list box. Do I need to create a variable to get the values of selections made in the list box and add it to the Expressions for the measures? I thought that Qlikview did that automatically.... Please help !
Accepted Solutions
- Mark as New
- Bookmark
- Subscribe
- Mute
- Subscribe to RSS Feed
- Permalink
- Report Inappropriate Content
Suggestions for debugging:
1. take out the "$<Parameter>" portion of your expression and let it just be an avg of chlorine level
2. check that your data is actually different in these fields in the back end
Any luck?
- Mark as New
- Bookmark
- Subscribe
- Mute
- Subscribe to RSS Feed
- Permalink
- Report Inappropriate Content
your definition is saying exclusive Parameter.
and this is working fine in Qlikview yes?
- Mark as New
- Bookmark
- Subscribe
- Mute
- Subscribe to RSS Feed
- Permalink
- Report Inappropriate Content
Yes, it seems to be working. I removed the $ from the set expression and that has sorted the issue. The chart is responding only to the list box now.
- Mark as New
- Bookmark
- Subscribe
- Mute
- Subscribe to RSS Feed
- Permalink
- Report Inappropriate Content
I removed the $<parameter = > part entirely and it's now working. Thank you! I'm new to qlikview, thank you for helping me learn!