Unlock a world of possibilities! Login now and discover the exclusive benefits awaiting you.
- Qlik Community
- :
- All Forums
- :
- QlikView App Dev
- :
- Re: Chart not showing correctly
Options
- Subscribe to RSS Feed
- Mark Topic as New
- Mark Topic as Read
- Float this Topic for Current User
- Bookmark
- Subscribe
- Mute
- Printer Friendly Page
Turn on suggestions
Auto-suggest helps you quickly narrow down your search results by suggesting possible matches as you type.
Showing results for
Creator III
2015-10-05
05:28 AM
- Mark as New
- Bookmark
- Subscribe
- Mute
- Subscribe to RSS Feed
- Permalink
- Report Inappropriate Content
Chart not showing correctly
I want the chart should like this
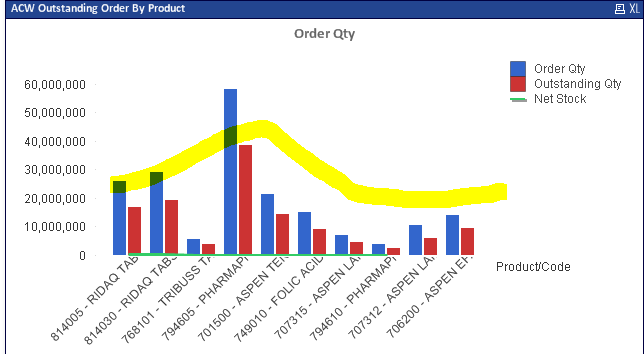
I want the nettstock should look like yellow line... indicating the nettstock. For that purpose we can fetch the highest nettstock.
Please find the sample model.
- Tags:
- new_to_qlikview
489 Views
1 Solution
Accepted Solutions
Specialist III
2015-10-05
05:32 AM
- Mark as New
- Bookmark
- Subscribe
- Mute
- Subscribe to RSS Feed
- Permalink
- Report Inappropriate Content
change the axes to right for the expression netstock and see
431 Views
3 Replies
Specialist III
2015-10-05
05:32 AM
- Mark as New
- Bookmark
- Subscribe
- Mute
- Subscribe to RSS Feed
- Permalink
- Report Inappropriate Content
change the axes to right for the expression netstock and see
432 Views
Partner - Champion
2015-10-05
05:40 AM
- Mark as New
- Bookmark
- Subscribe
- Mute
- Subscribe to RSS Feed
- Permalink
- Report Inappropriate Content
On the Axes tab of your chart, set the two QTY expressions to use the Left axis, and the Net Stock expression to use the Right axis
Master III
2015-10-05
05:45 AM
- Mark as New
- Bookmark
- Subscribe
- Mute
- Subscribe to RSS Feed
- Permalink
- Report Inappropriate Content
please check
