Unlock a world of possibilities! Login now and discover the exclusive benefits awaiting you.
- Qlik Community
- :
- All Forums
- :
- QlikView App Dev
- :
- Re: Chart settings, adding value on data points
- Subscribe to RSS Feed
- Mark Topic as New
- Mark Topic as Read
- Float this Topic for Current User
- Bookmark
- Subscribe
- Mute
- Printer Friendly Page
- Mark as New
- Bookmark
- Subscribe
- Mute
- Subscribe to RSS Feed
- Permalink
- Report Inappropriate Content
Chart settings, adding value on data points
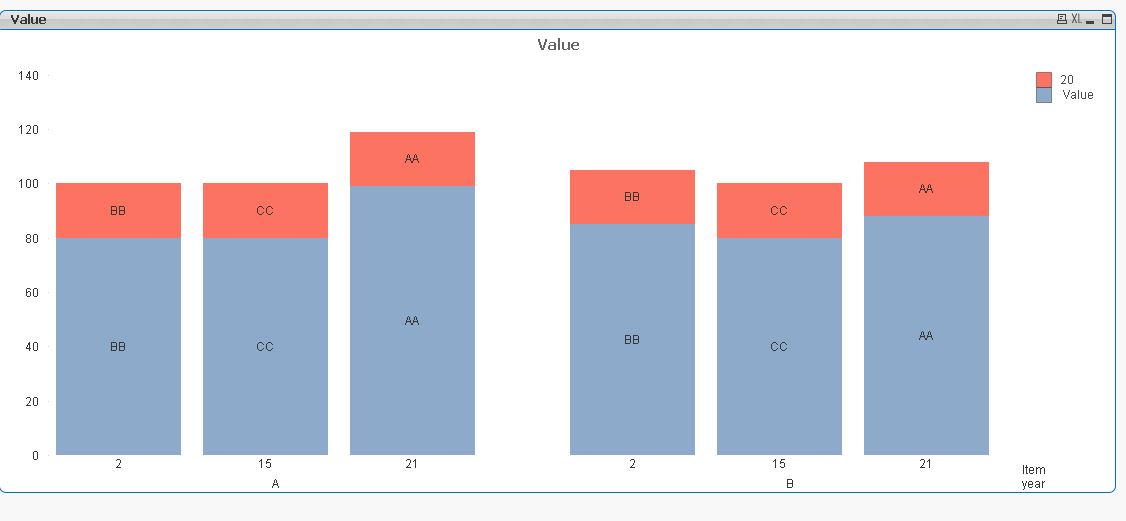
I have a 2 dimension bar chart with 2 expressions.
The expression values are stacked since it has 2 dimension.
I want to display a custom text inside the bars, but only for one of the bars.
When i enable plot data values inside segment, it adds it to both bars, is there a way to make it show only on one of the bar values ?
sample:
I want the text to show only on the red bars.

- « Previous Replies
- Next Replies »
Accepted Solutions
- Mark as New
- Bookmark
- Subscribe
- Mute
- Subscribe to RSS Feed
- Permalink
- Report Inappropriate Content
Would you mind upgrading to 11.20 SR4 (last one)?
- Mark as New
- Bookmark
- Subscribe
- Mute
- Subscribe to RSS Feed
- Permalink
- Report Inappropriate Content
try Instead of your expression "20", change it to dual(Text,20) and check Values on Data Points. Then you can get rid of your expression "Text".
Hope this helps!
- Mark as New
- Bookmark
- Subscribe
- Mute
- Subscribe to RSS Feed
- Permalink
- Report Inappropriate Content
dual(Text,20)changed everything 'AA' text.
Not exactly understanding the usage of Dual() yet
- Mark as New
- Bookmark
- Subscribe
- Mute
- Subscribe to RSS Feed
- Permalink
- Report Inappropriate Content
PFA
- Mark as New
- Bookmark
- Subscribe
- Mute
- Subscribe to RSS Feed
- Permalink
- Report Inappropriate Content
I might have not clarify my question properly but
I want to have custom text based on the rw data showing.
showing values works fine with the expression having values on data point enable but i require text, thats where the custom expression comes in, with bar disable. The problem is it, is showing in the other bar also, when i enable Plot values inside segment.
- Mark as New
- Bookmark
- Subscribe
- Mute
- Subscribe to RSS Feed
- Permalink
- Report Inappropriate Content
Jun
I hope I have understood what you are after, have a look at the attached and advise what you think.
Best Regards, Bill
- Mark as New
- Bookmark
- Subscribe
- Mute
- Subscribe to RSS Feed
- Permalink
- Report Inappropriate Content
It´s not exactly what you want, but maybe fits your needs
PFA
- Mark as New
- Bookmark
- Subscribe
- Mute
- Subscribe to RSS Feed
- Permalink
- Report Inappropriate Content
Hi Bill,
As mention in the first post, its a custom text i'm trying to display and not use the original value used to create the bar.
This is more of a formatting hack rather than using default chart settings.
- Mark as New
- Bookmark
- Subscribe
- Mute
- Subscribe to RSS Feed
- Permalink
- Report Inappropriate Content
Thanks, but i have already tried this.
But sadly, its requirements and i cant try alternative to the requested format.
Data wise, its showing all the number/text,
but they want it for the aesthetics.
- Mark as New
- Bookmark
- Subscribe
- Mute
- Subscribe to RSS Feed
- Permalink
- Report Inappropriate Content
Jun
I am not sure I understand what you mean by 'custom text' could you describe what text values you after and if appropriate the algorithm to create them ?
Best Regards, Bill
- « Previous Replies
- Next Replies »