Unlock a world of possibilities! Login now and discover the exclusive benefits awaiting you.
- Qlik Community
- :
- All Forums
- :
- QlikView App Dev
- :
- Re: Chart with selected Name and Total
- Subscribe to RSS Feed
- Mark Topic as New
- Mark Topic as Read
- Float this Topic for Current User
- Bookmark
- Subscribe
- Mute
- Printer Friendly Page
- Mark as New
- Bookmark
- Subscribe
- Mute
- Subscribe to RSS Feed
- Permalink
- Report Inappropriate Content
Chart with selected Name and Total
Hi friends,
I don't know how to make stacked chart with selected variable and Total?
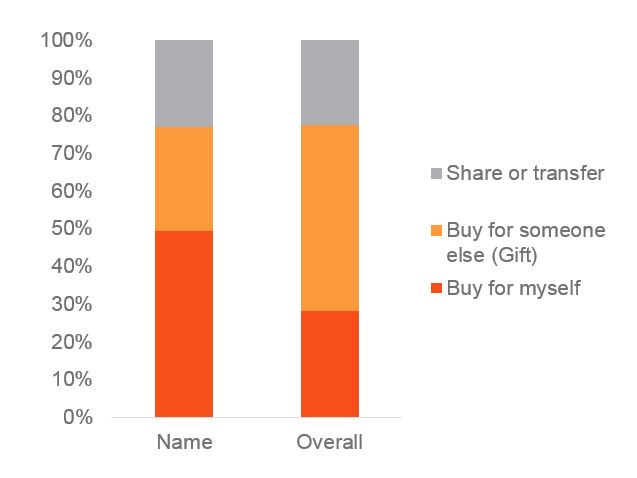
I have list box, where I select "name" from variable Name and compare to Overall (Total)
Please find my QV file.
Thanks
- Tags:
- new_to_qlikview
Accepted Solutions
- Mark as New
- Bookmark
- Subscribe
- Mute
- Subscribe to RSS Feed
- Permalink
- Report Inappropriate Content
I got it. Thank you, guys.
I used msolomov structure and combined with Rebecca idea
if(ValueList($(vValueList))='A',
count({<[POV]={'*myself*'}>}respondentID)/count({<[ POV]=>} respondentID),
if(ValueList($(vValueList))='B',
count({<[POV]={'*myself*'}>}respondentID)/count({<[POV]=>} respondentID),
count({1<[POV]={'*myself*'}>}respondentID)/count({1} respondentID))))
and so on for each POV
- Mark as New
- Bookmark
- Subscribe
- Mute
- Subscribe to RSS Feed
- Permalink
- Report Inappropriate Content
any ideas?
- Mark as New
- Bookmark
- Subscribe
- Mute
- Subscribe to RSS Feed
- Permalink
- Report Inappropriate Content
A sort of - see attached.
- Mark as New
- Bookmark
- Subscribe
- Mute
- Subscribe to RSS Feed
- Permalink
- Report Inappropriate Content
Something like this? Wouldn't work with a large number of names though.
- Mark as New
- Bookmark
- Subscribe
- Mute
- Subscribe to RSS Feed
- Permalink
- Report Inappropriate Content
Hi Rebecca,
Thanks for your helping.
It works well, but when Name doesn't have answers for 1 tag of POV, the Overall bar doesn't show all tags. (it not consist 100%) .
Do you know how to fix it?
Or you need sample QV file?
Thanks,
- Mark as New
- Bookmark
- Subscribe
- Mute
- Subscribe to RSS Feed
- Permalink
- Report Inappropriate Content
Thanks Michael,
Rebecca suggested better way.
In your sample I can't use legend and Name doesn't show "actual name"
Her sample doesn't show all tags for Overall, if Name doesn't have all tags.
Could you help with it?
Thanks again,
- Mark as New
- Bookmark
- Subscribe
- Mute
- Subscribe to RSS Feed
- Permalink
- Report Inappropriate Content
Hmm. That's weird. I would have thought the set analysis would have avoided that. I will play with it.
- Mark as New
- Bookmark
- Subscribe
- Mute
- Subscribe to RSS Feed
- Permalink
- Report Inappropriate Content
I updated the file.
The problem, when you select Name automatically selected POV.
- Mark as New
- Bookmark
- Subscribe
- Mute
- Subscribe to RSS Feed
- Permalink
- Report Inappropriate Content
I got it. Thank you, guys.
I used msolomov structure and combined with Rebecca idea
if(ValueList($(vValueList))='A',
count({<[POV]={'*myself*'}>}respondentID)/count({<[ POV]=>} respondentID),
if(ValueList($(vValueList))='B',
count({<[POV]={'*myself*'}>}respondentID)/count({<[POV]=>} respondentID),
count({1<[POV]={'*myself*'}>}respondentID)/count({1} respondentID))))
and so on for each POV