Unlock a world of possibilities! Login now and discover the exclusive benefits awaiting you.
- Qlik Community
- :
- All Forums
- :
- QlikView App Dev
- :
- Re: Class Function
- Subscribe to RSS Feed
- Mark Topic as New
- Mark Topic as Read
- Float this Topic for Current User
- Bookmark
- Subscribe
- Mute
- Printer Friendly Page
- Mark as New
- Bookmark
- Subscribe
- Mute
- Subscribe to RSS Feed
- Permalink
- Report Inappropriate Content
Class Function
I need to create a bar chart using the class function. I have the following data:
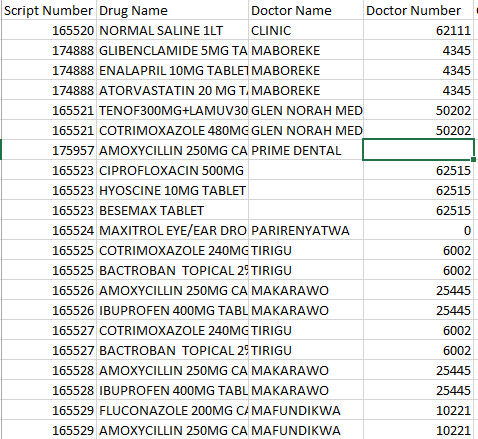
With the above data, I need to create a bar chart with a class interval of 1 on the X axis denoting the number of items per prescription interval, which will be count(Distinct [Script Number] ) and the number of Doctors which should be count(Distinct [Doctor Name]) on the Y axis. How can i achieve this with the Class function?
Regards
Chris
- Tags:
- qlikview
Accepted Solutions
- Mark as New
- Bookmark
- Subscribe
- Mute
- Subscribe to RSS Feed
- Permalink
- Report Inappropriate Content
Hi Yann
Many thanks, i have changed the dimension along your first suggestions to the following:
=Replace(Aggr(Class(count(DISTINCT [Drug Name]),1), [Script Number]), '<= x <', ' - ')
The expression is as follows:
=Aggr(count([Doctor Name]), [Script Number])
The result is as follows:
This more or less what I am expecting. The only problem is that I do not see any classes for Script Intervals less than 10. Would you suggest any solution?
- Mark as New
- Bookmark
- Subscribe
- Mute
- Subscribe to RSS Feed
- Permalink
- Report Inappropriate Content
Hi,
I'm not sure of what you want exactly, but I think it should be something like this :
dimension : =class(Aggr(count([Drug Name]),[Script number]),1) (or even directly =Aggr(count([Drug Name]),[Script number]) if the class interval is 1)
expression : count(distinct [Script number])
I hope it helps
Yann
- Mark as New
- Bookmark
- Subscribe
- Mute
- Subscribe to RSS Feed
- Permalink
- Report Inappropriate Content
Hi Yann
Many thanks, i get the following results after changing the expression to Count(Distinct [Doctor Name]):
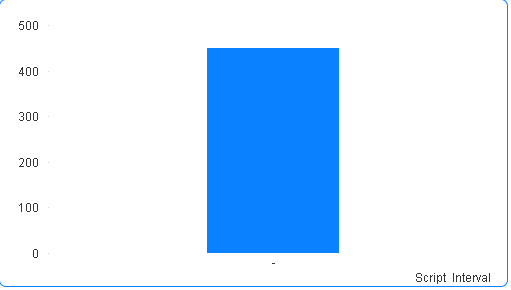
Either of the two dimensions yields the same result. This is showing the count of all doctors on the Y axis but i need this to be the count of doctors for a specific script interval. I hope this clarifies what i am looking for.
Thank you.
- Mark as New
- Bookmark
- Subscribe
- Mute
- Subscribe to RSS Feed
- Permalink
- Report Inappropriate Content
So you should use this as dimension :
=class([Script Number],1000, 'xxxx')
- Mark as New
- Bookmark
- Subscribe
- Mute
- Subscribe to RSS Feed
- Permalink
- Report Inappropriate Content
Hi Yann
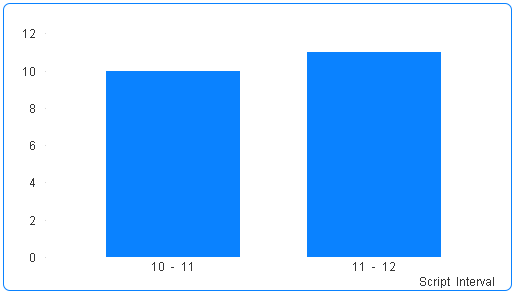
Many thanks, i have changed the dimension along your first suggestions to the following:
=Replace(Aggr(Class(count(DISTINCT [Drug Name]),1), [Script Number]), '<= x <', ' - ')
The expression is as follows:
=Aggr(count([Doctor Name]), [Script Number])
The result is as follows:
This more or less what I am expecting. The only problem is that I do not see any classes for Script Intervals less than 10. Would you suggest any solution?
- Mark as New
- Bookmark
- Subscribe
- Mute
- Subscribe to RSS Feed
- Permalink
- Report Inappropriate Content
as Count() delivers integer values, using the class function with an interval of 1 might be less readable than just displaying the integer itself, so:
=Aggr(count(DISTINCT [Drug Name]), [Script Number])
might actually be enough.
hope this helps
regards
Marco
- Mark as New
- Bookmark
- Subscribe
- Mute
- Subscribe to RSS Feed
- Permalink
- Report Inappropriate Content
Many thanks Marco