Unlock a world of possibilities! Login now and discover the exclusive benefits awaiting you.
- Qlik Community
- :
- All Forums
- :
- QlikView App Dev
- :
- Re: Color coding based on date
- Subscribe to RSS Feed
- Mark Topic as New
- Mark Topic as Read
- Float this Topic for Current User
- Bookmark
- Subscribe
- Mute
- Printer Friendly Page
- Mark as New
- Bookmark
- Subscribe
- Mute
- Subscribe to RSS Feed
- Permalink
- Report Inappropriate Content
Color coding based on date
Hi All.
I have created a chart table for a dataset. In the dataset I have a date field. I have connected that date field to master calender.
When I change the date, values of expression in chart table change accordingly as per the situation at the selected time.
The data actually has the date of activation for all features for a product on various clients/companies
I want to color code those features which have been activated in the last 3 days with red color.
Sample table that I have prepared is below:
Feature 1 Feature 2 Feature 3 Feature 4
Google 1 1 0 0
Amazon 0 0 0 1
Flipkart 0 1 1 1
FedEx 1 0 0 0
1 stands for active 0 stands for not active. A feature may not be active in 2011 but maybe active in 2018. Change in date shows this info accordingly.
I want to color code those clients where the value has become 1 for a feature in last two days. Need some formula
Can you suggest a solution
- Tags:
- new to qlikview
- new_to_qlikview
- qlikview devoloper
- qlikview experts
- qliview experts
- set analysis*
- visual cues expression
- Mark as New
- Bookmark
- Subscribe
- Mute
- Subscribe to RSS Feed
- Permalink
- Report Inappropriate Content
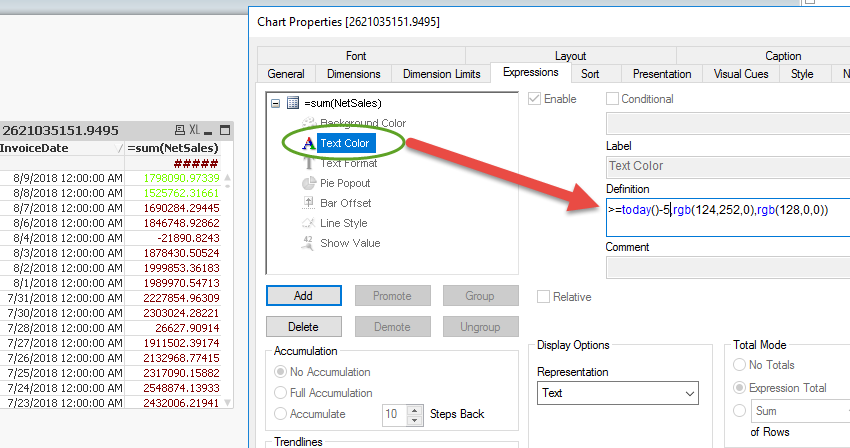
You might be able to do something like this:
=if(InvoiceDate>=today()-5,rgb(124,252,0),rgb(128,0,0))
You can do the same formatting on dimensions. You can do an "AND" to add the criteria for the value being a 1. I had to use today()-5 because today is Monday and the last date in our system was Friday, that way I go some stuff to change color. For the rgb colors, you can just google rgb values for different colors and choose whatever value you like. Hope this helps.

- Mark as New
- Bookmark
- Subscribe
- Mute
- Subscribe to RSS Feed
- Permalink
- Report Inappropriate Content
Hi Laura,
Thanks... This helped. However I am still not sure how to include that value='1' condition.
My expression is 'JSR'
- Mark as New
- Bookmark
- Subscribe
- Mute
- Subscribe to RSS Feed
- Permalink
- Report Inappropriate Content
You should be able to do something like this
=if(Date>=today()-2 AND YourField = 1,rgb(124,252,0),rgb(128,0,0))