Unlock a world of possibilities! Login now and discover the exclusive benefits awaiting you.
- Qlik Community
- :
- All Forums
- :
- QlikView App Dev
- :
- Color on a bar chart based on value (value = date ...
- Subscribe to RSS Feed
- Mark Topic as New
- Mark Topic as Read
- Float this Topic for Current User
- Bookmark
- Subscribe
- Mute
- Printer Friendly Page
- Mark as New
- Bookmark
- Subscribe
- Mute
- Subscribe to RSS Feed
- Permalink
- Report Inappropriate Content
Color on a bar chart based on value (value = date from master calendar)
Hello Everyone,
I'm using the master calendar in my script.
And I used that to display specific value based on weekyear (weeknumber and year)
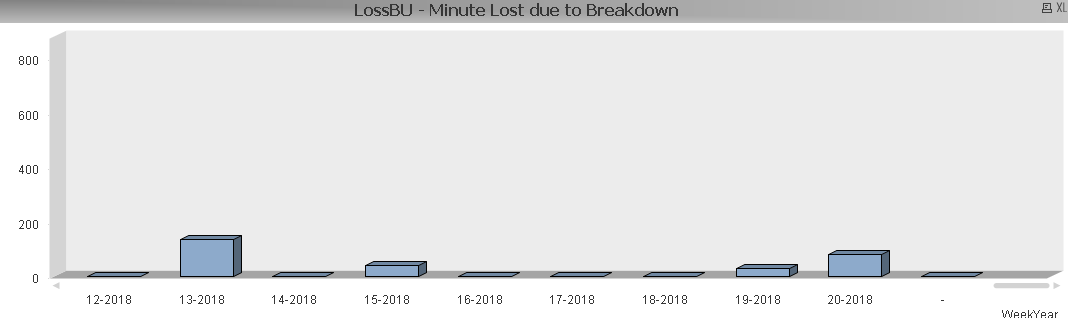
What i want to do is to put in Green the most recent bar in the chart. The most recent one is 20.2018 and i want it to be in different color for comparison aspect.
I know i have to go to background in the expression view
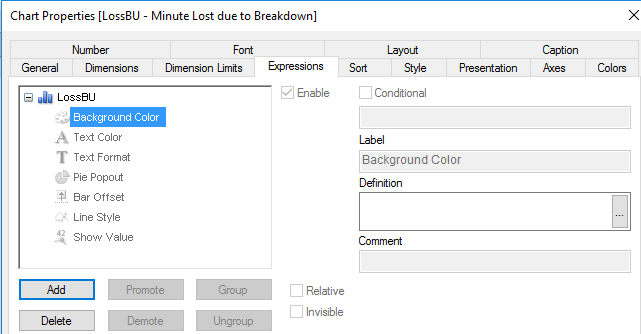
But as i'm a newcomer for qlikview i don't know the right formula to put in order to have the bar chart in blue for the latest (most recent week).
As I previously said I have a master calendar in my script
MasterCalendar:
Load
TempDate as Created,
week(TempDate) As Week,
Year(TempDate) As Year,
Month(TempDate) As Month,
Day(TempDate) As Day,
YeartoDate(TempDate)*-1 as CurYTDFlag,
YeartoDate(TempDate,-1)*-1 as LastYTDFlag,
inyear(TempDate, Monthstart($(varMaxDate)),-1) as RC12,
date(monthstart(TempDate), 'MMM-YYYY') as MonthYear,
ApplyMap('QuartersMap', month(TempDate), Null()) as Quarter,
Week(weekstart(TempDate)) & '-' & WeekYear(TempDate) as WeekYear,
WeekDay(TempDate) as WeekDay
And the field of the bar chart (which represent the expression i used in the form (sum(LossBU)) is
Anyone can help ?
Thank You 
- « Previous Replies
- Next Replies »
- Mark as New
- Bookmark
- Subscribe
- Mute
- Subscribe to RSS Feed
- Permalink
- Report Inappropriate Content
I tried but it's not working either.
Maybe it has to with the fact that I use this in the script and not in the variable overview
- Mark as New
- Bookmark
- Subscribe
- Mute
- Subscribe to RSS Feed
- Permalink
- Report Inappropriate Content
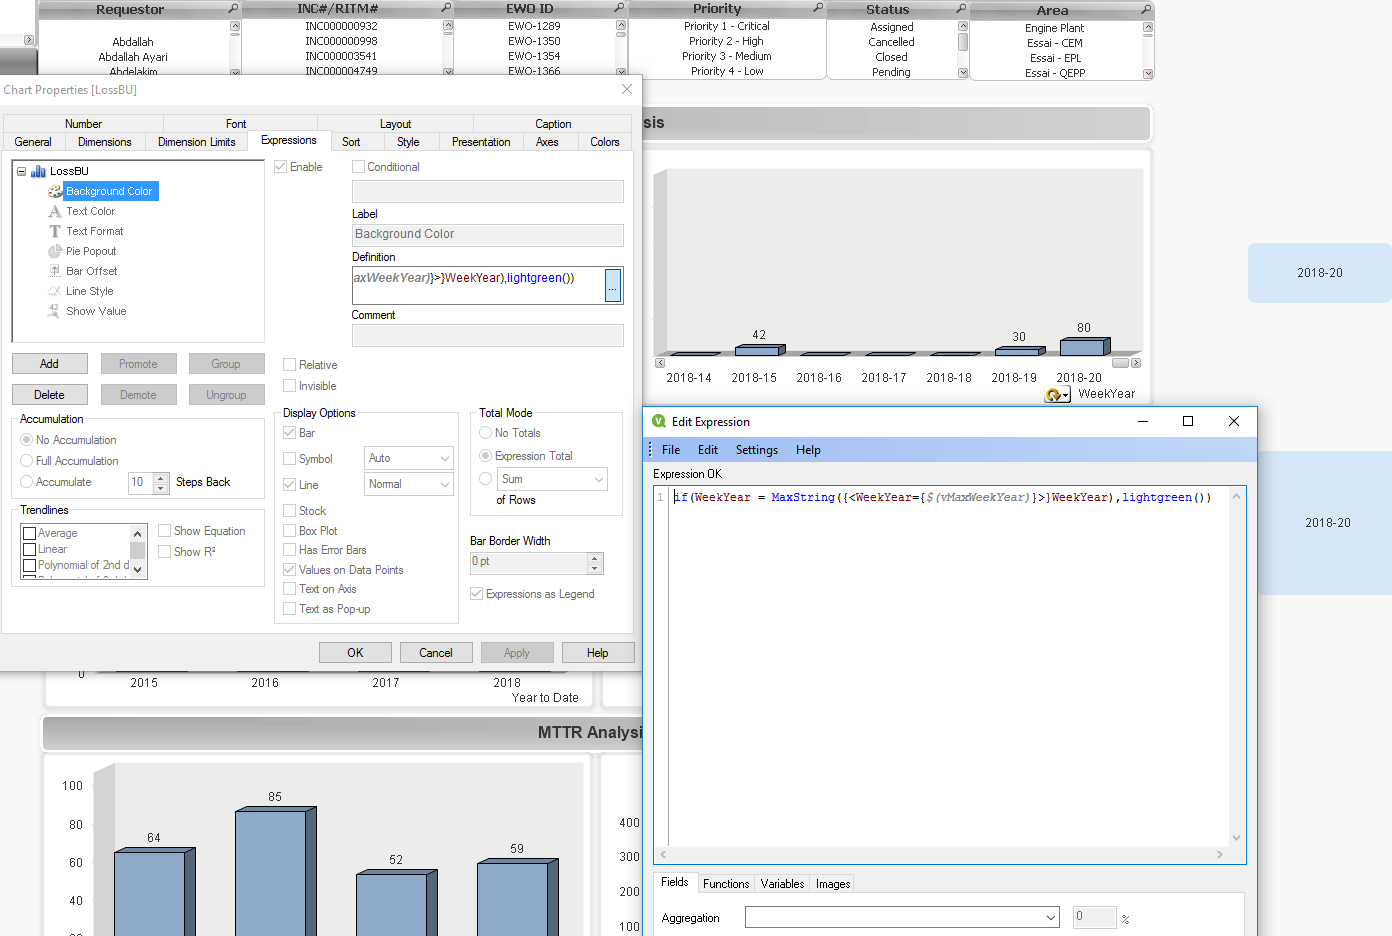
if the variable in the script is not working, delete it.
You need to get the expression right. Use a text box to make sure you have everything correct in the set analysis part. Try adding an = after dollar: $(=vMax....
- Mark as New
- Bookmark
- Subscribe
- Mute
- Subscribe to RSS Feed
- Permalink
- Report Inappropriate Content
It worked pretty well.
Thank you
- Mark as New
- Bookmark
- Subscribe
- Mute
- Subscribe to RSS Feed
- Permalink
- Report Inappropriate Content
No problem,
Good luck developing the rest of the application.
- « Previous Replies
- Next Replies »