Unlock a world of possibilities! Login now and discover the exclusive benefits awaiting you.
- Qlik Community
- :
- All Forums
- :
- QlikView App Dev
- :
- Color on a bar chart based on value (value = date ...
- Subscribe to RSS Feed
- Mark Topic as New
- Mark Topic as Read
- Float this Topic for Current User
- Bookmark
- Subscribe
- Mute
- Printer Friendly Page
- Mark as New
- Bookmark
- Subscribe
- Mute
- Subscribe to RSS Feed
- Permalink
- Report Inappropriate Content
Color on a bar chart based on value (value = date from master calendar)
Hello Everyone,
I'm using the master calendar in my script.
And I used that to display specific value based on weekyear (weeknumber and year)
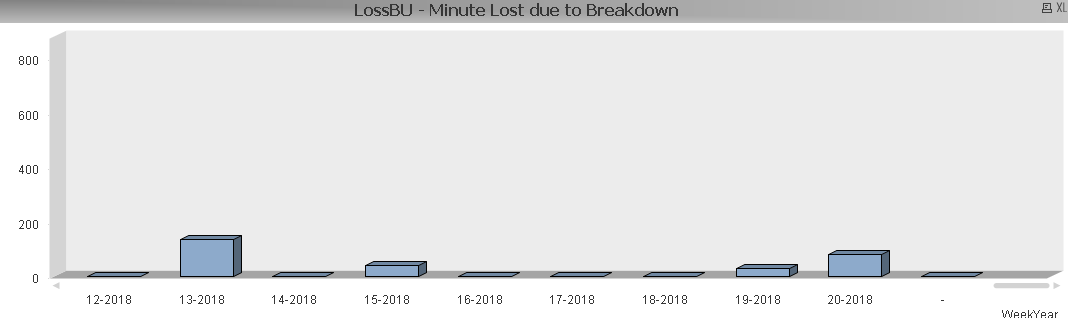
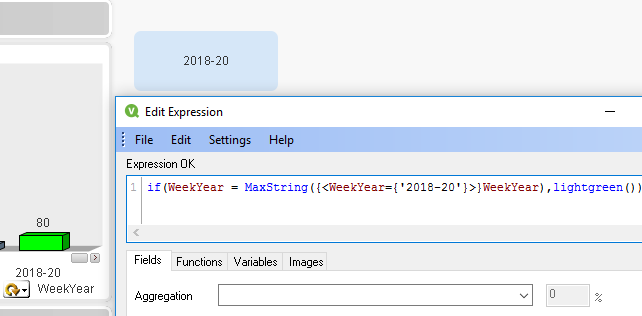
What i want to do is to put in Green the most recent bar in the chart. The most recent one is 20.2018 and i want it to be in different color for comparison aspect.
I know i have to go to background in the expression view
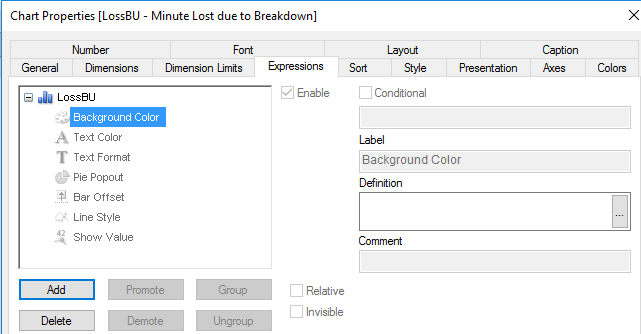
But as i'm a newcomer for qlikview i don't know the right formula to put in order to have the bar chart in blue for the latest (most recent week).
As I previously said I have a master calendar in my script
MasterCalendar:
Load
TempDate as Created,
week(TempDate) As Week,
Year(TempDate) As Year,
Month(TempDate) As Month,
Day(TempDate) As Day,
YeartoDate(TempDate)*-1 as CurYTDFlag,
YeartoDate(TempDate,-1)*-1 as LastYTDFlag,
inyear(TempDate, Monthstart($(varMaxDate)),-1) as RC12,
date(monthstart(TempDate), 'MMM-YYYY') as MonthYear,
ApplyMap('QuartersMap', month(TempDate), Null()) as Quarter,
Week(weekstart(TempDate)) & '-' & WeekYear(TempDate) as WeekYear,
WeekDay(TempDate) as WeekDay
And the field of the bar chart (which represent the expression i used in the form (sum(LossBU)) is
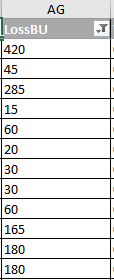
Anyone can help ?
Thank You 
- Mark as New
- Bookmark
- Subscribe
- Mute
- Subscribe to RSS Feed
- Permalink
- Report Inappropriate Content
Hi Yann,
I have looked at your qvw and encountered the issue that your WeekYear field is a string. So using Max() will not work. Instead, use MaxString.
However, since you have put the weeks in front of the year, week 9-2018 will be the max (since 9-.... is larger than 20-....).
Maybe you can fix this first by changing the calender putting year in front of week and then try the solutions mentioned above.
Greetings, Janneke.
- Mark as New
- Bookmark
- Subscribe
- Mute
- Subscribe to RSS Feed
- Permalink
- Report Inappropriate Content
Here is my modified master calendar:
MasterCalendar:
Load
TempDate as Created,
Year(TempDate) As Year,
Month(TempDate) As Month,
week(TempDate) As Week,
Day(TempDate) As Day,
YeartoDate(TempDate)*-1 as CurYTDFlag,
YeartoDate(TempDate,-1)*-1 as LastYTDFlag,
inyear(TempDate, Monthstart($(varMaxDate)),-1) as RC12,
date(monthstart(TempDate), 'MMM-YYYY') as MonthYear,
ApplyMap('QuartersMap', month(TempDate), Null()) as Quarter,
Week(weekstart(TempDate)) & '-' & WeekYear(TempDate) as WeekYear,
WeekDay(TempDate) as WeekDay
Resident TempCalendar
Order By TempDate ASC;
Drop Table TempCalendar;
Here is a screenshot of the modification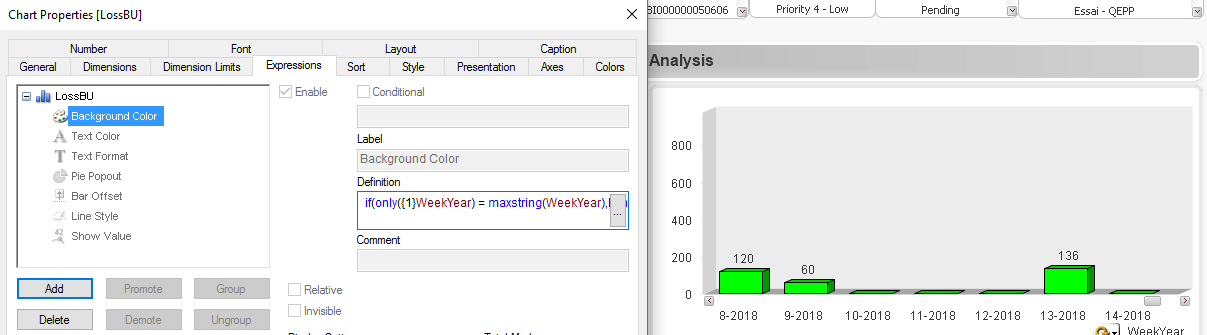
So If you are using a master calendar, could i have a sample where i could use min and max. I mean it's because of that that it's not working, right ?
- Mark as New
- Bookmark
- Subscribe
- Mute
- Subscribe to RSS Feed
- Permalink
- Report Inappropriate Content
Hi Yann,
Try WeekYear(TempDate) & '-' & Num(Week(weekstart(TempDate)),'00') as WeekYear.
This will put the year in front and puts a zero in front of one-digit-weeks (9 --> 09). Sorting is then correct.
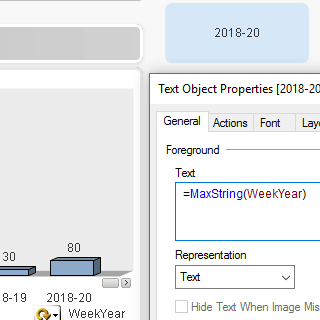
If you are not sure or it doesn't work, try testing parts of the expression (i.e. =MaxString(WeekYear)) in a text box, so you can understand how the definition is built.
Janneke.
- Mark as New
- Bookmark
- Subscribe
- Mute
- Subscribe to RSS Feed
- Permalink
- Report Inappropriate Content
Besides I have a cycle group in this chart (Weeks and Month) 
What would be the exact formula to include month as well ?
- Mark as New
- Bookmark
- Subscribe
- Mute
- Subscribe to RSS Feed
- Permalink
- Report Inappropriate Content
It's working on a tex box but not on a bar chart.
It drives me crazy.
But so far progress was made and i thank you for that. Do you think it has to do with the bar chart property ?
Besides i wanted to ask you
I have a cycle group in this chart (Weeks and Month) ![]()
What would be the exact formula to include month as well ?
Thank you thank you
- Mark as New
- Bookmark
- Subscribe
- Mute
- Subscribe to RSS Feed
- Permalink
- Report Inappropriate Content
It work when i Specify the weekyear...
- Mark as New
- Bookmark
- Subscribe
- Mute
- Subscribe to RSS Feed
- Permalink
- Report Inappropriate Content
Hi Yann,
Now you can put WeekYear in a variable:
vMaxWeekYear =MaxString(WeekYear)
Use this in the expression:
{<WeekYear={'$(=vMaxWeekYear)'}>}
Does this work?
Janneke
- Mark as New
- Bookmark
- Subscribe
- Mute
- Subscribe to RSS Feed
- Permalink
- Report Inappropriate Content
Sorry but i'm not very familiar for variable.
I added this in the script
But It doesn't appear neither in variable overview
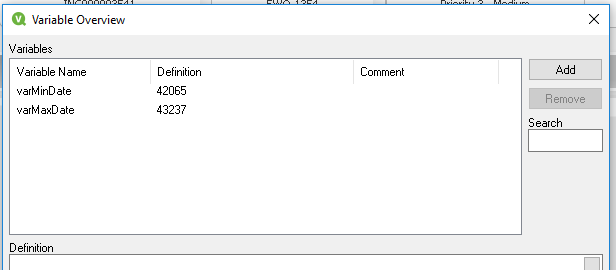
nor in a set analysis within a text box...
- Mark as New
- Bookmark
- Subscribe
- Mute
- Subscribe to RSS Feed
- Permalink
- Report Inappropriate Content
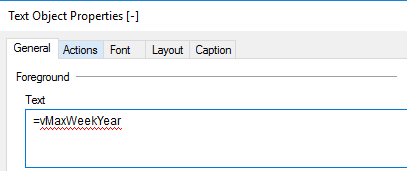
I suceeded putting up the variable in the exact menus 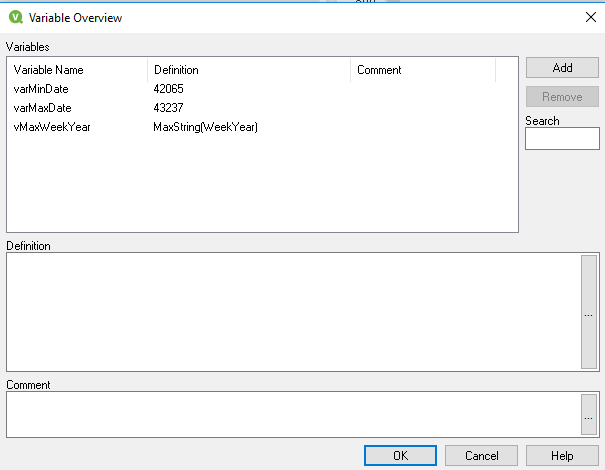
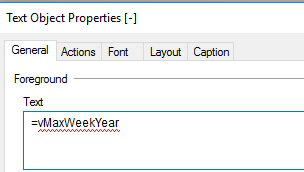
But the text box doesn't recognize the variable as well 😕
- Mark as New
- Bookmark
- Subscribe
- Mute
- Subscribe to RSS Feed
- Permalink
- Report Inappropriate Content
You need to use dollar sign: $(vMaxWeekYear).
If this is not working, then try to put =-sign in the variable: =MaxString(WeekYear)