Unlock a world of possibilities! Login now and discover the exclusive benefits awaiting you.
- Qlik Community
- :
- All Forums
- :
- QlikView App Dev
- :
- Colors in linear gauge
- Subscribe to RSS Feed
- Mark Topic as New
- Mark Topic as Read
- Float this Topic for Current User
- Bookmark
- Subscribe
- Mute
- Printer Friendly Page
- Mark as New
- Bookmark
- Subscribe
- Mute
- Subscribe to RSS Feed
- Permalink
- Report Inappropriate Content
Colors in linear gauge
Hello,
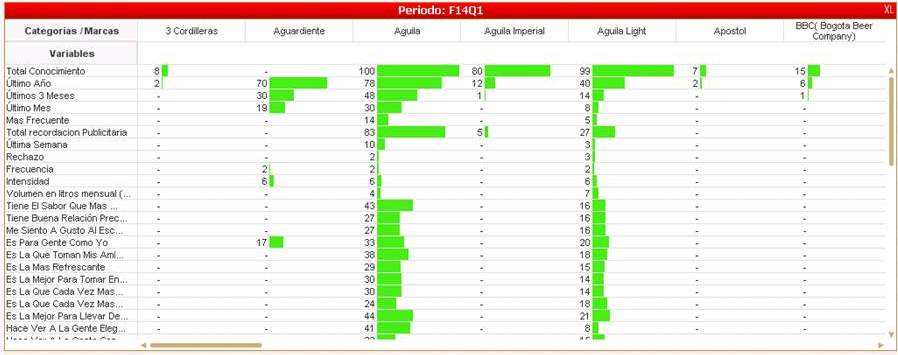
I'm trying to represent some values in a pivot table as linear gauges. I did that, but now I need to color each "Categoria / Marca" with an custom RGB that I have in an inline.
This is how the table actually looks:
The expression that I'm using in the "Segment" color is:
If($(vRegDemCat) = 2, Only({<Categoria_Marca>} RGB(R, G, B)))
I don't know what is wrong and why the dimensions aren't getting their colors.
Thanks a lot.
Kindest regards!
- Mark as New
- Bookmark
- Subscribe
- Mute
- Subscribe to RSS Feed
- Permalink
- Report Inappropriate Content
A set analysis expression creates one set per chart, not a set per dimension value. That's why your expression doesn't work. Perhaps this will do the job: If($(vRegDemCat) = 2, RGB(R, G, B)).
If not take a look at this blog post: Colors in charts
talk is cheap, supply exceeds demand
- Mark as New
- Bookmark
- Subscribe
- Mute
- Subscribe to RSS Feed
- Permalink
- Report Inappropriate Content
Hi, I have tried that and I didn't get any result, all I got is the same green for all dimensions.