Unlock a world of possibilities! Login now and discover the exclusive benefits awaiting you.
- Qlik Community
- :
- All Forums
- :
- QlikView App Dev
- :
- Re: Column no/row no as dimension in pivot table
- Subscribe to RSS Feed
- Mark Topic as New
- Mark Topic as Read
- Float this Topic for Current User
- Bookmark
- Subscribe
- Mute
- Printer Friendly Page
- Mark as New
- Bookmark
- Subscribe
- Mute
- Subscribe to RSS Feed
- Permalink
- Report Inappropriate Content
Column no/row no as dimension in pivot table
Hi all
I have the following pivot table. I want to add the red values as calculated dimension (these values are the number of the columns), but I'm not able to do that. Is there any function which I can use? Loading the rowno in the script is not a possibility.
| Country | 012014 1 | 022014 2 | 032014 3 |
|---|---|---|---|
| country1 | 200 | 300 | 400 |
| country2 | 300 | 400 | 500 |
Thank you in advance!
- « Previous Replies
-
- 1
- 2
- Next Replies »
- Mark as New
- Bookmark
- Subscribe
- Mute
- Subscribe to RSS Feed
- Permalink
- Report Inappropriate Content
Here it is an example
- Mark as New
- Bookmark
- Subscribe
- Mute
- Subscribe to RSS Feed
- Permalink
- Report Inappropriate Content
Thank you, but that is not what I'm looking for.
It could also be like this, so April could also be '1' and one or more months may be missing..
| Country | 042014 1 | 052014 2 | 072014 3 |
|---|---|---|---|
| country1 | 200 | 300 | 400 |
| country2 | 300 | 400 | 500 |
- Mark as New
- Bookmark
- Subscribe
- Mute
- Subscribe to RSS Feed
- Permalink
- Report Inappropriate Content
can try use ColumnNo(total) as expression.
- Mark as New
- Bookmark
- Subscribe
- Mute
- Subscribe to RSS Feed
- Permalink
- Report Inappropriate Content
Use RowNo(Total)
- Mark as New
- Bookmark
- Subscribe
- Mute
- Subscribe to RSS Feed
- Permalink
- Report Inappropriate Content
Thank you both, but that doesn't give me the desired result either.
I really need to add it as calculated dimension, but I don't think this is possible 
- Mark as New
- Bookmark
- Subscribe
- Mute
- Subscribe to RSS Feed
- Permalink
- Report Inappropriate Content
I think you can drag the expression like the 'fake' dimension in pivot table.
- Mark as New
- Bookmark
- Subscribe
- Mute
- Subscribe to RSS Feed
- Permalink
- Report Inappropriate Content
Try
Aggr(FieldName & Chr(13) & Chr(10) & RowNo(), FieldName)
Make the Wrap header text-->Header height to 2 lines in Presentation tab
- Mark as New
- Bookmark
- Subscribe
- Mute
- Subscribe to RSS Feed
- Permalink
- Report Inappropriate Content
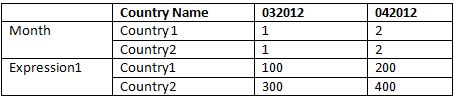
Yes, that's possible, but then I get the following result:
- Mark as New
- Bookmark
- Subscribe
- Mute
- Subscribe to RSS Feed
- Permalink
- Report Inappropriate Content
Hai Britt...
I just try This One Expression Dimension Field I hope U I'll Help it to u
Aggr(CODE& Chr(10) & RowNo(), CODE)
OR
CODE &''&Left(CODE,1)
My Output Like That

By
ArjunKrish
- « Previous Replies
-
- 1
- 2
- Next Replies »