Unlock a world of possibilities! Login now and discover the exclusive benefits awaiting you.
- Qlik Community
- :
- All Forums
- :
- QlikView App Dev
- :
- Re: Comaprison of Two Dates
- Subscribe to RSS Feed
- Mark Topic as New
- Mark Topic as Read
- Float this Topic for Current User
- Bookmark
- Subscribe
- Mute
- Printer Friendly Page
- Mark as New
- Bookmark
- Subscribe
- Mute
- Subscribe to RSS Feed
- Permalink
- Report Inappropriate Content
Comaprison of Two Dates
Hi All,
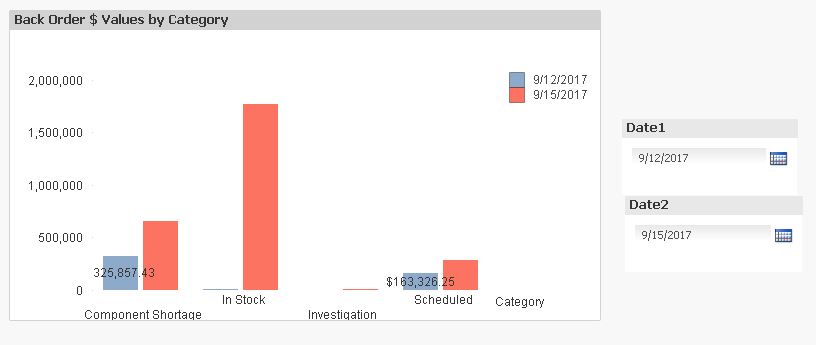
I have a chart showing Value vs Category.
In selection I have a date selection called Delivery Req. Date. And current logic is Qlik will calculate the Max Date and Max Date -30, on the basis of selected Date and show the values on that period.
Existing:
Now user wants to select two Delivery Req. Date and chart will show two bar chart against two date.
Can u please help me to implement that.
Required:
- Mark as New
- Bookmark
- Subscribe
- Mute
- Subscribe to RSS Feed
- Permalink
- Report Inappropriate Content
Hi Sarif, hope you are doing good.
The easiest way would be to include the date field in the dimension of the chart and exclude it's restriction from set analysis section of expression. PFA
- Mark as New
- Bookmark
- Subscribe
- Mute
- Subscribe to RSS Feed
- Permalink
- Report Inappropriate Content
HeyTresesco,
I am doing good. How about u?
Tresesco two things here:
1. User need to different Selection Box for Date.
2. There is a calculation like :
CstDate1 = {'>=$(=$(vMaxDate_30)) <$(=$(vMaxDate))'}
The selected date would participate in this Set Analysis.
Please let me know if you need any other info.
Thanks,
Sarif
- Mark as New
- Bookmark
- Subscribe
- Mute
- Subscribe to RSS Feed
- Permalink
- Report Inappropriate Content
Does this helps?
=Sum({<CstFiscalPeriod,CstFiscalYear,DateSnapshot_Key = {'$(=$(vDateSnapshot))'}, CstDate1 *= {">=$(=$(vMaxDate_30)) <=$(=$(vMaxDate))"}>} LineValue)
- Mark as New
- Bookmark
- Subscribe
- Mute
- Subscribe to RSS Feed
- Permalink
- Report Inappropriate Content
Can you please out this into the attached app and share.
This would be very helpful for me to understand in short time.
Thanks,
Sarif
- Mark as New
- Bookmark
- Subscribe
- Mute
- Subscribe to RSS Feed
- Permalink
- Report Inappropriate Content
You mean that there should be check that selected two dates should be within the given range?
- Mark as New
- Bookmark
- Subscribe
- Mute
- Subscribe to RSS Feed
- Permalink
- Report Inappropriate Content
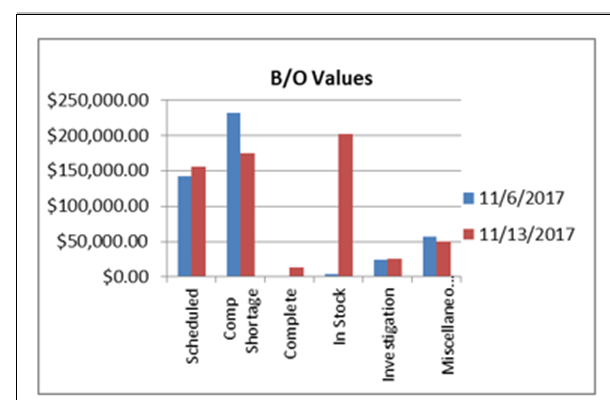
For two different Date Selection the similar logic would be applied.
Chart would display the value between selected date and (selected date - 30) range.
Sum({Date > Selected Date1 - 30 and Date< Selected Date1} Values)
Sum({Date > Selected Date2 - 30 and Date< Selected Date2} Values)
Please let me know if u need any further details.
Thanks,
Sarif
- Mark as New
- Bookmark
- Subscribe
- Mute
- Subscribe to RSS Feed
- Permalink
- Report Inappropriate Content
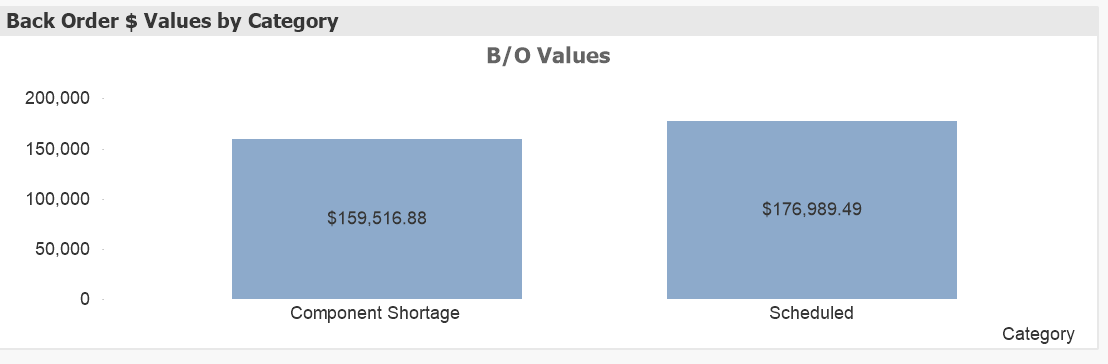
Something like this?