Unlock a world of possibilities! Login now and discover the exclusive benefits awaiting you.
- Qlik Community
- :
- All Forums
- :
- QlikView App Dev
- :
- Combination of Values
- Subscribe to RSS Feed
- Mark Topic as New
- Mark Topic as Read
- Float this Topic for Current User
- Bookmark
- Subscribe
- Mute
- Printer Friendly Page
- Mark as New
- Bookmark
- Subscribe
- Mute
- Subscribe to RSS Feed
- Permalink
- Report Inappropriate Content
Combination of Values
Hi Experts,
I have a requirement as below.
Sample Date:
| Custtomer | Column1 | Column2 | Column3 |
| A | 1 | 0 | 0 |
| B | 1 | 1 | 0 |
| C | 0 | 0 | 1 |
| D | 1 | 1 | 1 |
| E | 1 | 1 | 0 |
| F | 0 | 0 | 1 |
| G | 0 | 1 | 0 |
| H | 0 | 1 | 1 |
| I | 1 | 0 | 1 |
| J | 0 | 0 | 0 |
| K | 0 | 0 | 1 |
| L | 0 | 1 | 0 |
| M | 0 | 1 | 1 |
| N | 1 | 0 | 0 |
| O | 1 | 0 | 1 |
| P | 1 | 1 | 0 |
| Q | 1 | 1 | 1 |
I need to show in chart like,
1.How many customers have value in only Column1 but not in Column2 and 3
2. How many customers have value in only Column2 but not in Column1 and 3
3.How many customers have value in only Column3 but not in Column1 and 2
4.How many customers have value in only Column1 and Column2 but not in 3
5.How many customers have value in only Column1 but not in Column3 but not in 2 ans so on.
6.How many customers have value in all the columns.
Could you please help in completing this requirement.
Thanks
S k
- « Previous Replies
-
- 1
- 2
- Next Replies »
- Mark as New
- Bookmark
- Subscribe
- Mute
- Subscribe to RSS Feed
- Permalink
- Report Inappropriate Content
Thanks very much Sunny.
I think this will fulfill user requirement.
I'll try this and if any issues I'll let you know.
if possible can you please attach the qvw file for my reference.
- Mark as New
- Bookmark
- Subscribe
- Mute
- Subscribe to RSS Feed
- Permalink
- Report Inappropriate Content
Already did... open the link to see the attachement Re: Combination of Values
- Mark as New
- Bookmark
- Subscribe
- Mute
- Subscribe to RSS Feed
- Permalink
- Report Inappropriate Content
Hi Sunny,
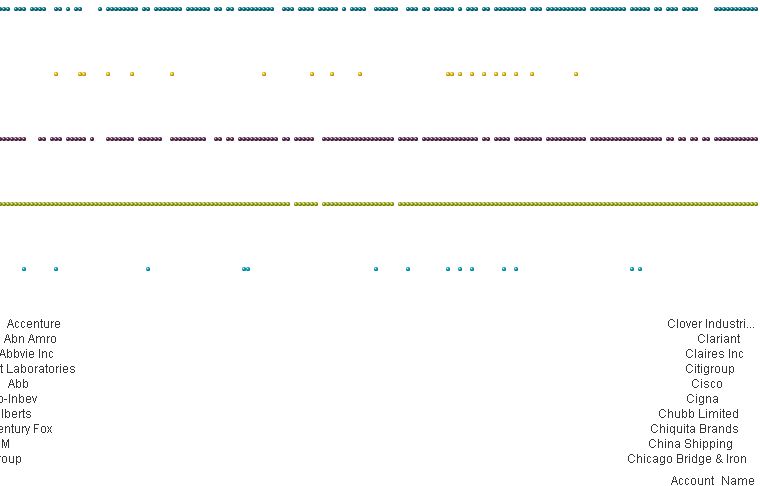
I am facing an issue here. If I use Account Name as Dimension and in My Original app there are ~2k Customers and the Chart is looking so weird.
Any Other Suggestion.
- Mark as New
- Bookmark
- Subscribe
- Mute
- Subscribe to RSS Feed
- Permalink
- Report Inappropriate Content
Hi Shivesh,
Thanks very much for the Response but if I use the above expression then I have to build the same expression for different combinations.
Thanks,
S k
- Mark as New
- Bookmark
- Subscribe
- Mute
- Subscribe to RSS Feed
- Permalink
- Report Inappropriate Content
Hi SK,
Since you have too many customers i would recommend to use a pivot table. (ref the attached).
Br,
KC
KC
- Mark as New
- Bookmark
- Subscribe
- Mute
- Subscribe to RSS Feed
- Permalink
- Report Inappropriate Content
Hi KC,
Attachment is missing 
Thanks,
Sk
- Mark as New
- Bookmark
- Subscribe
- Mute
- Subscribe to RSS Feed
- Permalink
- Report Inappropriate Content
I can see the attachment
Attached again.
KC
- Mark as New
- Bookmark
- Subscribe
- Mute
- Subscribe to RSS Feed
- Permalink
- Report Inappropriate Content
What do you want it to show? May be add a scroll bar so that not all the customer show up at the same time?
- « Previous Replies
-
- 1
- 2
- Next Replies »