Unlock a world of possibilities! Login now and discover the exclusive benefits awaiting you.
- Qlik Community
- :
- All Forums
- :
- QlikView App Dev
- :
- Re: Re: Combining X axes from two charts to a sing...
- Subscribe to RSS Feed
- Mark Topic as New
- Mark Topic as Read
- Float this Topic for Current User
- Bookmark
- Subscribe
- Mute
- Printer Friendly Page
- Mark as New
- Bookmark
- Subscribe
- Mute
- Subscribe to RSS Feed
- Permalink
- Report Inappropriate Content
Combining X axes from two charts to a single one
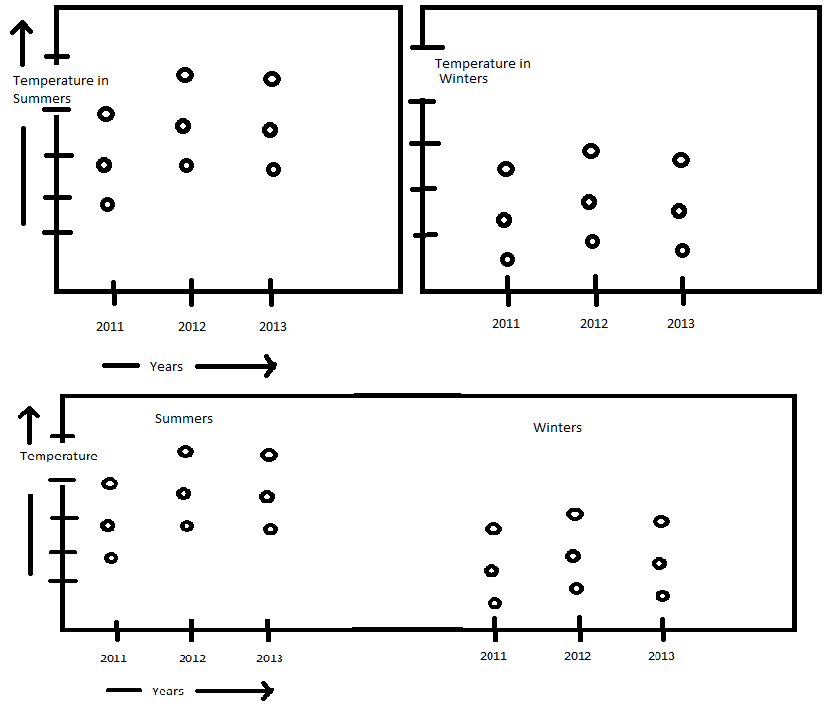
I have two charts each representing the average temperature of 3 cities in 3 consecutive years. The difference in the charts is - one represents average temperature of cities during Summers and the other one during Winters. The charts can be seen in the photo attached which gives the concept of these charts.
I want both chart to be combined and represent in a single chart as shown in the 3rd part og the photo attached. Is it possible to combine X axes of two different charts and represent the details separately in a single chart. Please help me in achieving this exact behaviour. I'm not getting the idea of combining X axes of two different charts to a single one.
Thanks in advance....
- Mark as New
- Bookmark
- Subscribe
- Mute
- Subscribe to RSS Feed
- Permalink
- Report Inappropriate Content
Hello Nishant -
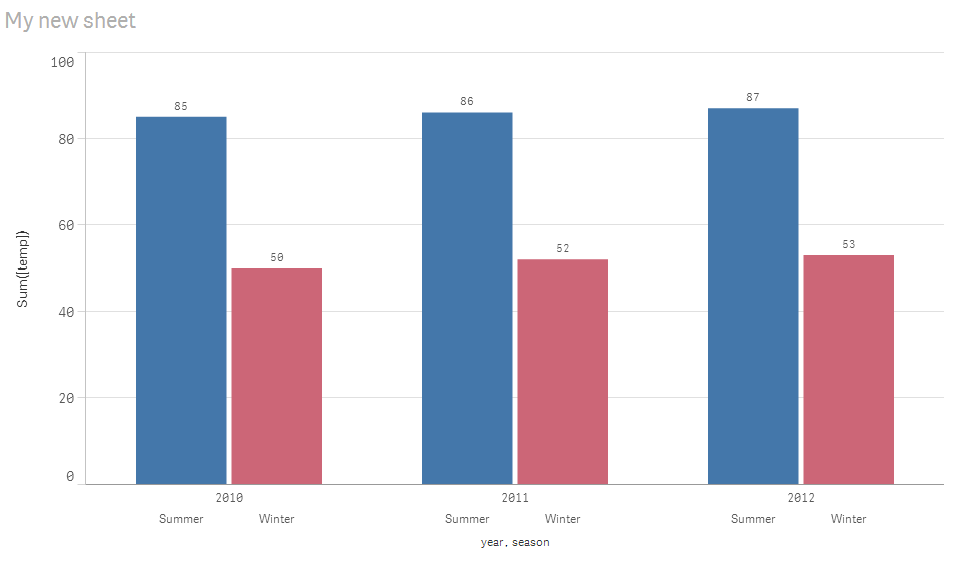
The answer to your question will vary greatly depending on how your data is structured. It would seem that if you had a metric - temperature and two dimensions Year, and Season - you should be able to create on chart that uses 2 dimensions and 1 metric.
| Year | Season | Temperature |
|---|---|---|
| 2010 | Summer | 82 |
| 2010 | Winter | 50 |
| 2011 | Summer | 85 |
| 2011 | Winter | 52 |
| 2012 | Summer | 86 |
| 2012 | Winter | 53 |
Is that not the case?
How is your data structured?
Here is a simple example - using a Bar Chart.
Please let us know.
(Please mark the appropriate replies as helpful / correct so our team and other members know that your question(s) has been answered to your satisfaction.)
Regards,
Mike
Mike Tarallo
Qlik
- Mark as New
- Bookmark
- Subscribe
- Mute
- Subscribe to RSS Feed
- Permalink
- Report Inappropriate Content
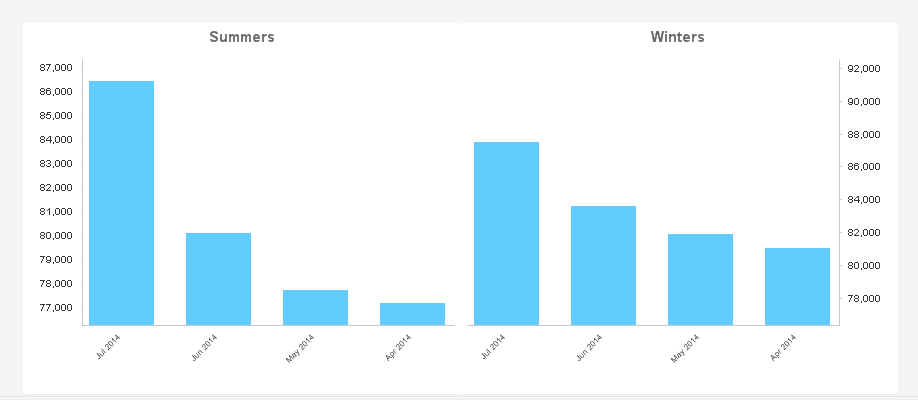
Nishant
You could combine two bar charts (see below) with the axis of the second chart to display on right hand side. The only other way I can think of is by using 'Trellis' in chart properties under Dimensions.
Again as Mike suggested it depends on how your data is structured. Attach a sample if possible.
- Mark as New
- Bookmark
- Subscribe
- Mute
- Subscribe to RSS Feed
- Permalink
- Report Inappropriate Content
Koushik - good point. I see your screen shot is for QlikView. I had responded assuming Sense.
Nishant Gupta - is this for QlikView or Sense?
Thanks Koushik for your reply as well. 🙂
Mike
Mike Tarallo
Qlik
- Mark as New
- Bookmark
- Subscribe
- Mute
- Subscribe to RSS Feed
- Permalink
- Report Inappropriate Content
I have attached my sample here. The two charts show animation on fixed X-axis position. First one on X=1 and the other on X=2. Right now the value of X-axis is hard coded for both charts i.e. 1 and 2. But I want both the charts to be merged into one chart and value of X-axis should be taken from the Position table defined in the sample. That is, for position1 (X=1), values in Y axis should represent T1. Similarly for position2 from Position table (X=2), values on Y axis should represent T2.
Please help me in achieving this. Thanks a lot in advance..
- Mark as New
- Bookmark
- Subscribe
- Mute
- Subscribe to RSS Feed
- Permalink
- Report Inappropriate Content
Hi Nishant - I see you are using QlikView - I will move the discussion to the appropriate forum.
Mike
Mike Tarallo
Qlik
- Mark as New
- Bookmark
- Subscribe
- Mute
- Subscribe to RSS Feed
- Permalink
- Report Inappropriate Content
Hi Nishant
I understand you posted a sample content but its vague. There is no link between 'Position' and SerialNumber, Year, T1, T2 fields. Qlikview doesnt have a functionality of merging two charts but you can force it by using set analysis into one chart if the data is aligned properly. It will come close to what you want to achieve by using bar or line charts. If you are using Ajax version then there shuold be a plugin available on the Qlikview market or by any other 3rd party company.
You can scramble the data and post a snapshot of it with a diag you want to achieve.
Regards
Koushik Vutha