Unlock a world of possibilities! Login now and discover the exclusive benefits awaiting you.
- Qlik Community
- :
- All Forums
- :
- QlikView App Dev
- :
- Re: Combining povit columns and comparing data in...
- Subscribe to RSS Feed
- Mark Topic as New
- Mark Topic as Read
- Float this Topic for Current User
- Bookmark
- Subscribe
- Mute
- Printer Friendly Page
- Mark as New
- Bookmark
- Subscribe
- Mute
- Subscribe to RSS Feed
- Permalink
- Report Inappropriate Content
Combining povit columns and comparing data in povit
Hi Team,
Good day 
please look on bellow issue
How to combine the columns expression into one column?
- « Previous Replies
-
- 1
- 2
- Next Replies »
- Mark as New
- Bookmark
- Subscribe
- Mute
- Subscribe to RSS Feed
- Permalink
- Report Inappropriate Content
With more complex expressions, this might get a little hard to read.
You can also use a pick(match()) combination and using Column()
=Pick(
Match(Column(1)&Column(2)&Column(3)&Column(4) , $(=Concat(Code,','))),
$(=Concat(Chr(39)&status&chr(39),',',Code))
)
Note that your code table shows two entries for code 6565, average and good. Is this intended?
edit:
Or using your expression labels:
=Pick( Match(H&E&F&G , $(=Concat(Code,','))),
$(=Concat(Chr(39)&status&chr(39),',',Code))
- Mark as New
- Bookmark
- Subscribe
- Mute
- Subscribe to RSS Feed
- Permalink
- Report Inappropriate Content
Hi Sunny T,
coud you pleae give some explanation of
=Aggr(If(if(A=1,'5',if(A=0,'6'))&if(B=1,'5',if(B=0,'6'))&if(C=1,'5',if(C=0,'6'))&if(D=1,'5',if(D=0,'6')) * 1 = Code, status), Code, CITY)
*1 means it wil convert to text correct me i said any wrong?
- Mark as New
- Bookmark
- Subscribe
- Mute
- Subscribe to RSS Feed
- Permalink
- Report Inappropriate Content
Yes the idea is to convert the text to number by multiplying it by 1
- Mark as New
- Bookmark
- Subscribe
- Mute
- Subscribe to RSS Feed
- Permalink
- Report Inappropriate Content
hi sunny ,
i tired your expression in my dashboard
bellow screen shot please observe
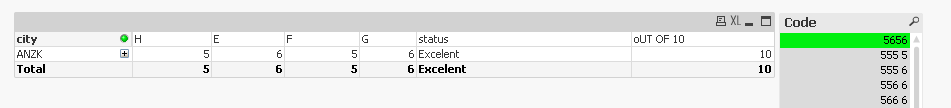
here i if select Code in list box then i am able to see "status" and "out of 10" columns data.
in pivot table i have city ,place,land mark,area like these kind of drill down dimensions
here when i select Code that time why Status and OUT of 10 coulms data will be display?
- Mark as New
- Bookmark
- Subscribe
- Mute
- Subscribe to RSS Feed
- Permalink
- Report Inappropriate Content
Not sure I understand the difference between the screenshots. I mean are these taken from two different applications? same application different charts? What's the difference?
- Mark as New
- Bookmark
- Subscribe
- Mute
- Subscribe to RSS Feed
- Permalink
- Report Inappropriate Content
yes perfectly correct ...
same appliction different charts..one is povit and second one is list box
for understanding the difference i attached screen shot
screen shot 1 :if i select "CODE" column values i am able to see the data in Status and Out of 10 Column data
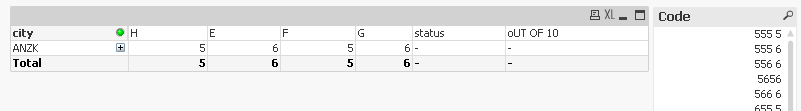
screen shot 2:if i unselect "CODE" column values i am not able to see the data in Status and Out of 10 Column data
but i dont see Iist box in my application i want only pivot with our any select any code column like bellow
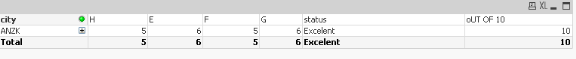
i need out put like above screen shot only .
regards,
bobby
- Mark as New
- Bookmark
- Subscribe
- Mute
- Subscribe to RSS Feed
- Permalink
- Report Inappropriate Content
Might be that you are running into one of the pitfalls using aggr()
e.g. grain mismatch or missing outer aggregation.
We would need to take a closer look at your data model to tell you more.
Have you tried what I've suggested above using pick(match() ), i.e. not using the aggr() function?
- Mark as New
- Bookmark
- Subscribe
- Mute
- Subscribe to RSS Feed
- Permalink
- Report Inappropriate Content
yes i tired that but sorry to say it"s not useful for me
and can we try VLOOKUP for this .but i am nout sure vlookup is working in qik view or not
like:
VLOOKUP(CONCATENATE(Column(1)&Column(2)&Column(3)&Column(4)),'Code'), "Unexplained Result")
can we achievable using Vlookup ?
Regards,
Bobs
- Mark as New
- Bookmark
- Subscribe
- Mute
- Subscribe to RSS Feed
- Permalink
- Report Inappropriate Content
No. No VLOOKUP available in QV chart expression.
Could you explain why the other approach was not useful for you? Maybe this helps in understanding your other issue as well.
Or just create a small sample file, so we can stop guessing around?
- Mark as New
- Bookmark
- Subscribe
- Mute
- Subscribe to RSS Feed
- Permalink
- Report Inappropriate Content
For more details please look the bellow link
mapping Pivot column Test to another table column Test
Regards,
Bob
- « Previous Replies
-
- 1
- 2
- Next Replies »