Unlock a world of possibilities! Login now and discover the exclusive benefits awaiting you.
- Qlik Community
- :
- All Forums
- :
- QlikView App Dev
- :
- Combo Chart
- Subscribe to RSS Feed
- Mark Topic as New
- Mark Topic as Read
- Float this Topic for Current User
- Bookmark
- Subscribe
- Mute
- Printer Friendly Page
- Mark as New
- Bookmark
- Subscribe
- Mute
- Subscribe to RSS Feed
- Permalink
- Report Inappropriate Content
Combo Chart
Hi,
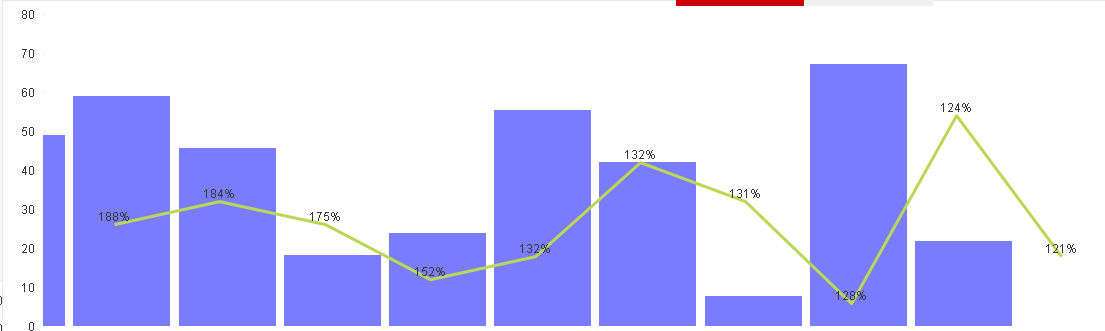
May i know why my combo chart looks like this after i restrict largest 10 in the dimension using the first expression and promoted the calculated expression to the first.
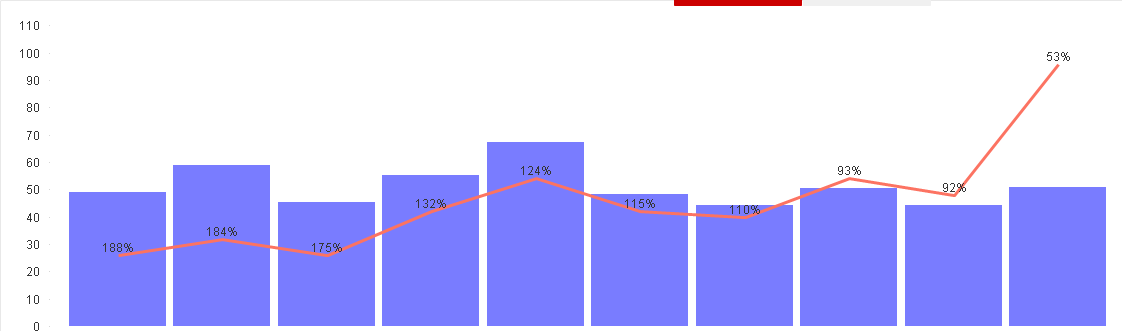
Otherwise, it looks like this but the sequence (4th bar changed) is not what i desire:
Accepted Solutions
- Mark as New
- Bookmark
- Subscribe
- Mute
- Subscribe to RSS Feed
- Permalink
- Report Inappropriate Content
Hi,
Have changed from largest ten to first ten and it works fine.
Thanks Anil!
- Mark as New
- Bookmark
- Subscribe
- Mute
- Subscribe to RSS Feed
- Permalink
- Report Inappropriate Content
Can you share sample test? Not sure, How you written the expression
- Mark as New
- Bookmark
- Subscribe
- Mute
- Subscribe to RSS Feed
- Permalink
- Report Inappropriate Content
Hi,
I have one dimension - Branch and three express - sum(Case Count), sum(Branch UL Target) and sum([Case Count])/sum([Branch UL Target]). After i restrict to top 10 and promote sum([Case Count])/sum([Branch UL Target]) to the first expression, the chart looks like the first picture and when sum(case count) is in the first expression, it looks like the second pic.
- Mark as New
- Bookmark
- Subscribe
- Mute
- Subscribe to RSS Feed
- Permalink
- Report Inappropriate Content
Hi,
Have changed from largest ten to first ten and it works fine.
Thanks Anil!
- Mark as New
- Bookmark
- Subscribe
- Mute
- Subscribe to RSS Feed
- Permalink
- Report Inappropriate Content
Hahaha