Unlock a world of possibilities! Login now and discover the exclusive benefits awaiting you.
- Qlik Community
- :
- All Forums
- :
- QlikView App Dev
- :
- Common 'Period' filter visible for multiple tabs/t...
- Subscribe to RSS Feed
- Mark Topic as New
- Mark Topic as Read
- Float this Topic for Current User
- Bookmark
- Subscribe
- Mute
- Printer Friendly Page
- Mark as New
- Bookmark
- Subscribe
- Mute
- Subscribe to RSS Feed
- Permalink
- Report Inappropriate Content
Common 'Period' filter visible for multiple tabs/table
Hi all,
In my report I have more than 5 tabs(pages) and each of them displays data from individual QVDs(almost). I have a common area at the top of the report to display the filters (listboxes) . In that , I have to place period related listboxes like Year , Month.
Should I load the period column from all the QVDs with same name (say, Period) and display the year as Year(Period) and month as Month(Period) or I can load periods with names related to tabs (say PeriodForTab1 , PeriodForTab2 , etc) and load the listboxes with respective data visible for each tab alone ? I tried both the ways , in the former way I get some numbers in the tables inside the tabs but in the latter way I am getting different numbers upon selecting same year / month combo. My basic requirement is to have common name for the period.(The former way).
Please pour in your suggestions/ideas.
-James
- « Previous Replies
-
- 1
- 2
- Next Replies »
- Mark as New
- Bookmark
- Subscribe
- Mute
- Subscribe to RSS Feed
- Permalink
- Report Inappropriate Content
Hi,
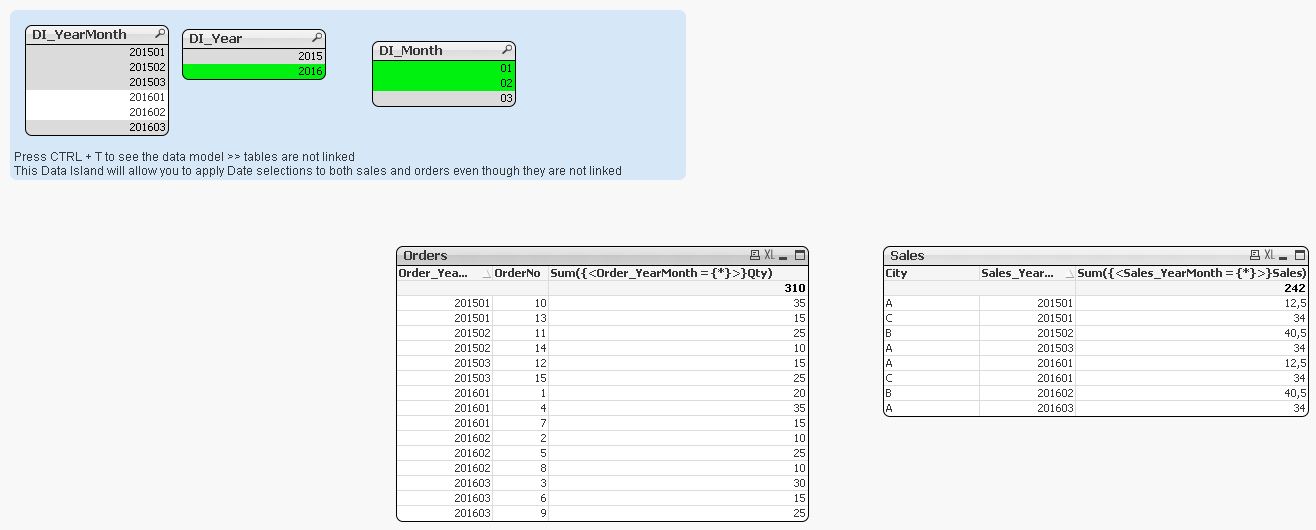
In your example you have used the following expression to show the 'Sum' of Qty in the 'Order' table.
Sum({<Order_YearMonth = {$(vDIYearMonth)}>}Qty)
So here in your expression you have a variable vDIYearMonth which will give the 'DI_YearMonth' which is selected in the selected and MaxString(DI_YearMonth) if nothing is selected. Can this be changed to display all the YearMonth's data if nothing is selected ? If so how should I do that ?
-JB
- Mark as New
- Bookmark
- Subscribe
- Mute
- Subscribe to RSS Feed
- Permalink
- Report Inappropriate Content
Hi James,
You can create a link table. bring the common fields in link table and drop them from individual table.
Please find attached the example for the same.
Hope it helps you. 
- Mark as New
- Bookmark
- Subscribe
- Mute
- Subscribe to RSS Feed
- Permalink
- Report Inappropriate Content
If you would like to default the period all periods when nothing is selected, then change the definition of the varable vDIYearMonth to:
=if(GetPossibleCount(DI_YearMonth) <> 1, '*',DI_YearMonth)
* changed above
This will give you all YearMonth periods if nothing is selected instead of showing the latest period only.
- Mark as New
- Bookmark
- Subscribe
- Mute
- Subscribe to RSS Feed
- Permalink
- Report Inappropriate Content
Hi,
This version has a lag in showing the months if more than one month is selected. See below snapshot.
Here you can see data for months 01 and 02 for 2016 are displayed , but all the data from 2015 are also displayed which is not selected. How can we modify the variable to display the selected months alone ?
-JB
- Mark as New
- Bookmark
- Subscribe
- Mute
- Subscribe to RSS Feed
- Permalink
- Report Inappropriate Content
Hi JB,
Please see attached.
It’s fairly flexible...Pay attention to the variables
Although I must agree that the Link table may be a better option. Up to you..
Hope this helps!
- Mark as New
- Bookmark
- Subscribe
- Mute
- Subscribe to RSS Feed
- Permalink
- Report Inappropriate Content
Your Concat variable worked for my req.
Thanks,
JB
- Mark as New
- Bookmark
- Subscribe
- Mute
- Subscribe to RSS Feed
- Permalink
- Report Inappropriate Content
One last doubt. Can the order and sales tables be combined into one single table ? I mean to display a common YearMonth dimension and display Sum of order and Sum of sales in expression ?
-JB.
- Mark as New
- Bookmark
- Subscribe
- Mute
- Subscribe to RSS Feed
- Permalink
- Report Inappropriate Content
Hi JB,
Yes it can be done that way.
- Mark as New
- Bookmark
- Subscribe
- Mute
- Subscribe to RSS Feed
- Permalink
- Report Inappropriate Content
Thanks for your reply.
But specifically we are adding the Order_YearMonth or Sales_YearMonth in the dimension , right ? Do we need to add both the dimensions together in one table, align the sorting and hide anyone ? Or does this need to be combined in script itself ? If so how it should be combined ?
-JB
- Mark as New
- Bookmark
- Subscribe
- Mute
- Subscribe to RSS Feed
- Permalink
- Report Inappropriate Content
Hi,
See attached.
Basically create one field for YearMonth and a new field to flag Sales or Orders.
Thanks,
- « Previous Replies
-
- 1
- 2
- Next Replies »