Unlock a world of possibilities! Login now and discover the exclusive benefits awaiting you.
- Qlik Community
- :
- All Forums
- :
- QlikView App Dev
- :
- Compare Sum of Month with Sum of previous Month
- Subscribe to RSS Feed
- Mark Topic as New
- Mark Topic as Read
- Float this Topic for Current User
- Bookmark
- Subscribe
- Mute
- Printer Friendly Page
- Mark as New
- Bookmark
- Subscribe
- Mute
- Subscribe to RSS Feed
- Permalink
- Report Inappropriate Content
Compare Sum of Month with Sum of previous Month
Hi all,
I would like to calculate the sum of a Month and compare it with the sum of the previous month to find the difference between those two.
E.g. sum(Anzahl_Autos) //in February
sum(Anzahl_Autos) //in January
// And the find the difference
And so on over the whole year. So that I can build a chart to display the 'Growth' of several Periods
I tried a lot, but couldn't find a solution.
In the attached file you can find some test data.
It would be so nice if somebody could help me with that.
Kind regards
Philipp
Accepted Solutions
- Mark as New
- Bookmark
- Subscribe
- Mute
- Subscribe to RSS Feed
- Permalink
- Report Inappropriate Content
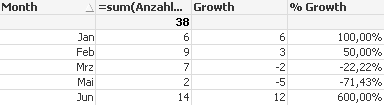
In the table showing quantity by month, add the expressions:
=Column(1) - Alt(Above(Column(1)), 0) // for growth
=Alt((Column(1) - Above(Column(1))) / Above(Column(1)), 1) // for % growth
- Mark as New
- Bookmark
- Subscribe
- Mute
- Subscribe to RSS Feed
- Permalink
- Report Inappropriate Content
Have a look on the last links in this posting: How to use - Master-Calendar and Date-Values
- Marcus
- Mark as New
- Bookmark
- Subscribe
- Mute
- Subscribe to RSS Feed
- Permalink
- Report Inappropriate Content

- Mark as New
- Bookmark
- Subscribe
- Mute
- Subscribe to RSS Feed
- Permalink
- Report Inappropriate Content
In the table showing quantity by month, add the expressions:
=Column(1) - Alt(Above(Column(1)), 0) // for growth
=Alt((Column(1) - Above(Column(1))) / Above(Column(1)), 1) // for % growth
- Mark as New
- Bookmark
- Subscribe
- Mute
- Subscribe to RSS Feed
- Permalink
- Report Inappropriate Content
hi, thanks for the help!!
Is it possible, or is there a way to use the above() function also if I have 2 dimensions?!
- Mark as New
- Bookmark
- Subscribe
- Mute
- Subscribe to RSS Feed
- Permalink
- Report Inappropriate Content
Just add your required dimension, it should work.