Unlock a world of possibilities! Login now and discover the exclusive benefits awaiting you.
- Qlik Community
- :
- All Forums
- :
- QlikView App Dev
- :
- Comparing 2 months data in a table
- Subscribe to RSS Feed
- Mark Topic as New
- Mark Topic as Read
- Float this Topic for Current User
- Bookmark
- Subscribe
- Mute
- Printer Friendly Page
- Mark as New
- Bookmark
- Subscribe
- Mute
- Subscribe to RSS Feed
- Permalink
- Report Inappropriate Content
Comparing 2 months data in a table
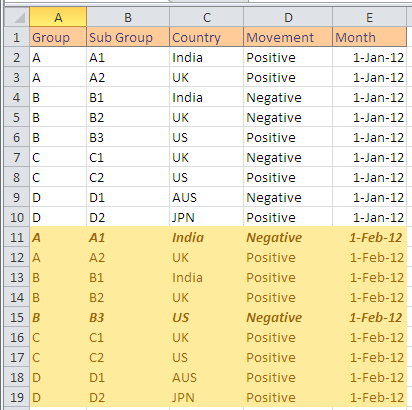
Hi, I need help in creating a Pivot or Straight Table with following kind of Data. Its mainly comparing 2 months data. In the below example I have data for 2 months Jan and Feb for a perticular Group and sub group, which shows a movevent (Positive or Negative) for each month. Now I need to show all the data which has a negative movement in the month of Feb (Row 11 and 15). Along with that I need to show the movement of the same in its previous month i.e: JAN. Either in a table or in Pvt Table. Please help me resolving as I am not able to put 2 months data in the Pvt Table.
- Mark as New
- Bookmark
- Subscribe
- Mute
- Subscribe to RSS Feed
- Permalink
- Report Inappropriate Content
Hi,
You use Set Analysis Expression ' Count( {$<Movement = {Negative}>} 1) '. You will get the MonthWise Negative
Movement .
Hope its useful for u .
Regards,
Iyyappan.
- Mark as New
- Bookmark
- Subscribe
- Mute
- Subscribe to RSS Feed
- Permalink
- Report Inappropriate Content
Hi,
Have a look at the attached application.
Regards,
Kaushik Solanki