Unlock a world of possibilities! Login now and discover the exclusive benefits awaiting you.
- Qlik Community
- :
- All Forums
- :
- QlikView App Dev
- :
- Re: Comparing expression values
- Subscribe to RSS Feed
- Mark Topic as New
- Mark Topic as Read
- Float this Topic for Current User
- Bookmark
- Subscribe
- Mute
- Printer Friendly Page
- Mark as New
- Bookmark
- Subscribe
- Mute
- Subscribe to RSS Feed
- Permalink
- Report Inappropriate Content
Comparing expression values
I've been using QlikView off and on over the months/years, I'm essentially a one trick pony. Note how I don't call myself an old dog, because you know what they say about them and new tricks, and I'm in need of one!
Here's my case. Raw data is an Excel sheet:
ColA is a date field, specifically of the time a report is run.
ColB is a code from that report
ColC is a computer name
I have a straight table set up in QV like this:
Dimensions: ColB, ColA
Expression: count(ColC)
This gives me the total number of times a computer reported each code on each report date.
What I would like to be able to do is to compare the results of those counts across reports. Did CodeX show up fewer times on Date1 than Date2? Did CodeY disappear on Date2? Is CodeZ a new code to appear?
I'd settle for the first scenario if that is the easiest/most feasible to get going, but the other two would also be sweet.
I've tried tinkering with putting the data in Pivot Tables, and I also tried experimenting with the Aggr() function, but I was mostly flailing (and failing). There's no real pressure to get this done, as I basically use Qlikview for myself (I work for an NGO, so big expenditures are few and far between) and what I want this new trick of mine to do IS technically doable manually. But, like I said, if I can double the number of tricks I have in this program, that much the better!
TIA
- Mark as New
- Bookmark
- Subscribe
- Mute
- Subscribe to RSS Feed
- Permalink
- Report Inappropriate Content
Hi Drew, Answered your first question using Alternate States and Set Analysis. Please try the other 2 yourself. If you still need help, let me know.
Thanks,
Ram
- Mark as New
- Bookmark
- Subscribe
- Mute
- Subscribe to RSS Feed
- Permalink
- Report Inappropriate Content
Thank you very much for your rapid reply, Ram. I neglected to mention, though, that I am using the Free/Personal edition of QV. That means I am unable to open your file. My apologies for not making this clear initially.
Could you please post the code/expressions/etc. that you used? Again, my appreciation for your quick response, and my apologies for not being clear in my initial question.
- Mark as New
- Bookmark
- Subscribe
- Mute
- Subscribe to RSS Feed
- Permalink
- Report Inappropriate Content
too many steps involved.
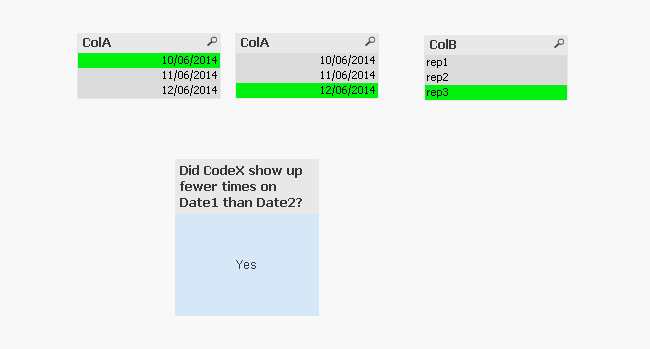
Goto Document properties, Alternate States, create 2 alternate States. Compare1 and Compare2.
Create 2 list boxes for your date column and assign the respective alternate states.
Now create 2 variables. Date1 and Date2 with the following expressions respectively.
=only({Compare1}ColA}
=only({Compare2}ColA}
Have a list box for your ColB.
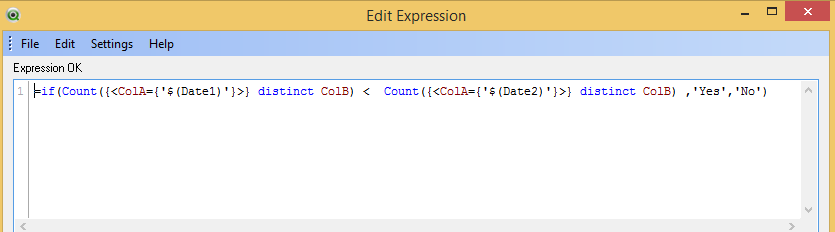
Now you have a text box with the expression in the picture attached.
Thanks,
Ram
- Mark as New
- Bookmark
- Subscribe
- Mute
- Subscribe to RSS Feed
- Permalink
- Report Inappropriate Content
- Mark as New
- Bookmark
- Subscribe
- Mute
- Subscribe to RSS Feed
- Permalink
- Report Inappropriate Content
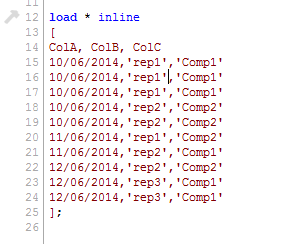 Used this sample data.
- Mark as New
- Bookmark
- Subscribe
- Mute
- Subscribe to RSS Feed
- Permalink
- Report Inappropriate Content
Thank you again for laying all of this out! I appreciate all of the effort you are putting forth to assist me.
Unfortunately, in my text box, I get an error when trying to use the Alternate States.
=if(count({<RepDate={'$(Date1)'}>} DISTINCT [RepCode] < count({<RepDate={'$(Date2)'}>} DISTINCT [RepCode]),'Yes','No')
That is the value for text (Alternate State is 'inherited'), but when I click OK I get:
Error: Error in expression: Nested aggregation not allowed.
Do you have any suggestions?
- Mark as New
- Bookmark
- Subscribe
- Mute
- Subscribe to RSS Feed
- Permalink
- Report Inappropriate Content
can you attach your qvw please?
Thanks,
Ram
- Mark as New
- Bookmark
- Subscribe
- Mute
- Subscribe to RSS Feed
- Permalink
- Report Inappropriate Content
You are missing a bracket ')' after Distinct [RepCode]. Please correct it.
if(count({<RepDate={'$(Date1)'}>} Distinct [RepCode]),,,,,,,,,,,,,,,,,,,,,,,,,,
- Mark as New
- Bookmark
- Subscribe
- Mute
- Subscribe to RSS Feed
- Permalink
- Report Inappropriate Content
Very astute, that corrected it. Thank you very much for all of your assistance.