Unlock a world of possibilities! Login now and discover the exclusive benefits awaiting you.
- Qlik Community
- :
- All Forums
- :
- QlikView App Dev
- :
- Comparing the same expression from different dimen...
- Subscribe to RSS Feed
- Mark Topic as New
- Mark Topic as Read
- Float this Topic for Current User
- Bookmark
- Subscribe
- Mute
- Printer Friendly Page
- Mark as New
- Bookmark
- Subscribe
- Mute
- Subscribe to RSS Feed
- Permalink
- Report Inappropriate Content
Comparing the same expression from different dimension
I have 3 dimensions in my table: PERIOD,COACH & PEOPLE. In this model every coach have some people in charge, so when I expand every coach's cell, it displays the people in charge of that Coach.
In the chart, I have an expression (RATE) for each person of each coach. For example: RATE1: (TIME WORKED/TOTAL TIME)
and when I contract to the coach's level, I get the same rate for the coach.
I know this rate would be like this: RATE2:(Sum(TIMEWORKED)/(TOTAL TIME*count(PEOPLE OF THE COACH))
So what I need is to store this 2 variables and compare both. I tried using as the first expression: Aggr(RATE,PEOPLE) and as the second one: Aggr(RATE, COACH). But it didn't work
(RATE is stored as a variable)
If the idea is not clear yet, I post a picture of what I want.
By the way, I have no rights to edit any dimension.
Hope someone could help me as quick as possible 
Thanks!
- Mark as New
- Bookmark
- Subscribe
- Mute
- Subscribe to RSS Feed
- Permalink
- Report Inappropriate Content
Hey Bastian,
Please check out the document attached and see if it meets your requirement.
Thanks
AJ
- Mark as New
- Bookmark
- Subscribe
- Mute
- Subscribe to RSS Feed
- Permalink
- Report Inappropriate Content
AJ,
Thanks for the answer, but regrettably it doesn't match what I was looking for.
The main problem I have, is storing data generated by the chart and then compare with something else.
For example: I calculate a Rate for each person of every coach, the when I contract this column, I'll automatically get the same RATE (The same function but different value. Is like an average but is not) for the coach. I want to store this RATE (COACH) in another expression (Column) and then compare both RATES:
First:
| PERIOD | COACH | PEOPLE | RATE | RATE COACH | COMP |
|---|---|---|---|---|---|
| Jan | Bob  | Bryan | 10% | - | - |
| Lilly | 15% | - | - | ||
| George | 55% | - | - | ||
| Jimmy | 45% | - | - | ||
| Julian | 30% | - | - | ||
Second: After contract Coach
| PERIOD | COACH | PEOPLE | RATE | RATE COACH | COMP |
|---|---|---|---|---|---|
| Jan | Bob  | - | 35% | - | - |
Third: Comparing
| PERIOD | COACH | PEOPLE | RATE | RATE COACH | COMP |
|---|---|---|---|---|---|
| Jan | Bob | Bryan | 10% | 35% | BAD |
| Lilly | 15% | 35% | BAD | ||
| George | 55% | 35% | GOOD | ||
| Jimmy | 45% | 35% | BAD | ||
| Julian | 30% | 35% | BAD | ||
A this (I think) is the whole process, I hope this could help.
Thanks again for your effort, I appreciate!
- Mark as New
- Bookmark
- Subscribe
- Mute
- Subscribe to RSS Feed
- Permalink
- Report Inappropriate Content
So in the file attached there is a pivot table and a straight table.
Looking at the pivot table
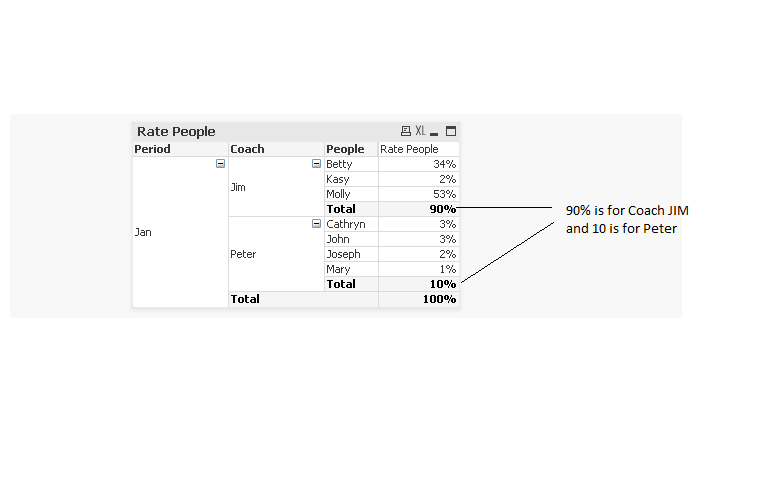
Here if you press the - sign near Betty or Cathryn it will shrink and show the results for the Coaches.
So as per your requirement you want the 90 and 10(values for the two coaches Jim and Peter respectively) displayed across each person so that you can calculate the grade, right? and thats what is happening here:
I was just using some dummy values with some dummy expressions. You can tailor them to your needs.Does this make sense?
If you can give me some data and fields that you are working with I can try to replicate the same you have in your screen shot.
- Mark as New
- Bookmark
- Subscribe
- Mute
- Subscribe to RSS Feed
- Permalink
- Report Inappropriate Content
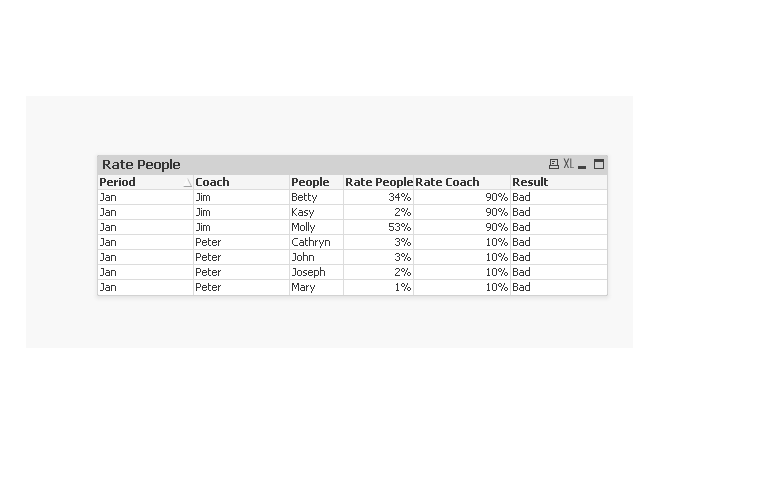
Oh I think now i see what you are looking. You want them in Pivot table itself.
Alright check this out.
- Mark as New
- Bookmark
- Subscribe
- Mute
- Subscribe to RSS Feed
- Permalink
- Report Inappropriate Content
I'm gonna check now, I'll let you know.
Thanks AJ