Unlock a world of possibilities! Login now and discover the exclusive benefits awaiting you.
- Qlik Community
- :
- All Forums
- :
- QlikView App Dev
- :
- Re: Comparison chart Vs month per unit Total compa...
- Subscribe to RSS Feed
- Mark Topic as New
- Mark Topic as Read
- Float this Topic for Current User
- Bookmark
- Subscribe
- Mute
- Printer Friendly Page
- Mark as New
- Bookmark
- Subscribe
- Mute
- Subscribe to RSS Feed
- Permalink
- Report Inappropriate Content
Comparison chart Vs month per unit Total company (Gráfico comparativo mes por unidad Vs Total compañia)
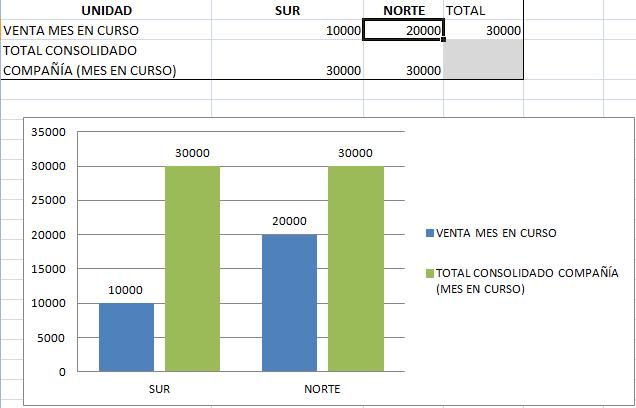
I am new to QlikView, I would ask for support because I could not mount a chart in Excel is easy (picture attached), it goes something like this:
I have 2 units in the company: (South and North)
I want to be a graphic in a bar where I show the sales of each unit (I'm using a 'UNIT' and dimension and SALES MONTH as 'expression'
NORTH SOUTH UNIT
MONTH SALES $ 10,000 $ 20,000
Now I want to add a new bara graph showing the total SALES MONTH of the company, in the example would be $ 30,000, that is, want this fixed value would show no change when selecting a unit.
First of all, Thanks,
Translated with Google Translate - Qlik Community Administrative Team
Soy nuevo en Qlikview, te quisiera pedir apoyo porque no he podido montar un gráfico, en excel es sencillo (imagen que adjunto), va mas o menos asi:
Tengo 2 unidades en la compañia: (Sur y norte)
Quiero representar un gráfico donde en una barra me muestre las ventas de cada unidad (estoy empleando a 'UNIDAD' como dimensión y a VENTAS MES como 'expresión'
UNIDAD SUR NORTE
VENTAS MES $ 10.000 $ 20.000
Ahora bien, quiero añadir una nueva bara al gráfico que muestre el total VENTAS MES de la compañia, en el ejemplo seria $ 30.000, es decir, quisiera que este valor se mostrase fijo, sin cambiar al seleccionar alguna unidad.
De antemano gracias,
- Mark as New
- Bookmark
- Subscribe
- Mute
- Subscribe to RSS Feed
- Permalink
- Report Inappropriate Content
Hi,
find the attached, may be helps.
- Mark as New
- Bookmark
- Subscribe
- Mute
- Subscribe to RSS Feed
- Permalink
- Report Inappropriate Content
Hola Eduardo,
puedes usar la función de total
seria algo como sum(Total VENTAS MES), aunque esto cambia dependiendo de la selecciones que tengas, si quieres que también ignore las selecciones que tengas entonces usa esto sum(Total {1} VENTAS MES)
- Mark as New
- Bookmark
- Subscribe
- Mute
- Subscribe to RSS Feed
- Permalink
- Report Inappropriate Content
Gracias Ramon, probe con TOTAL y me dio el producto esperado.
Muchas Gracas@