Unlock a world of possibilities! Login now and discover the exclusive benefits awaiting you.
- Qlik Community
- :
- All Forums
- :
- QlikView App Dev
- :
- Re: Comparitive Analysis
- Subscribe to RSS Feed
- Mark Topic as New
- Mark Topic as Read
- Float this Topic for Current User
- Bookmark
- Subscribe
- Mute
- Printer Friendly Page
- Mark as New
- Bookmark
- Subscribe
- Mute
- Subscribe to RSS Feed
- Permalink
- Report Inappropriate Content
Comparitive Analysis
how to do comparative analysis of more than one field
Let me explain u about my scenario:
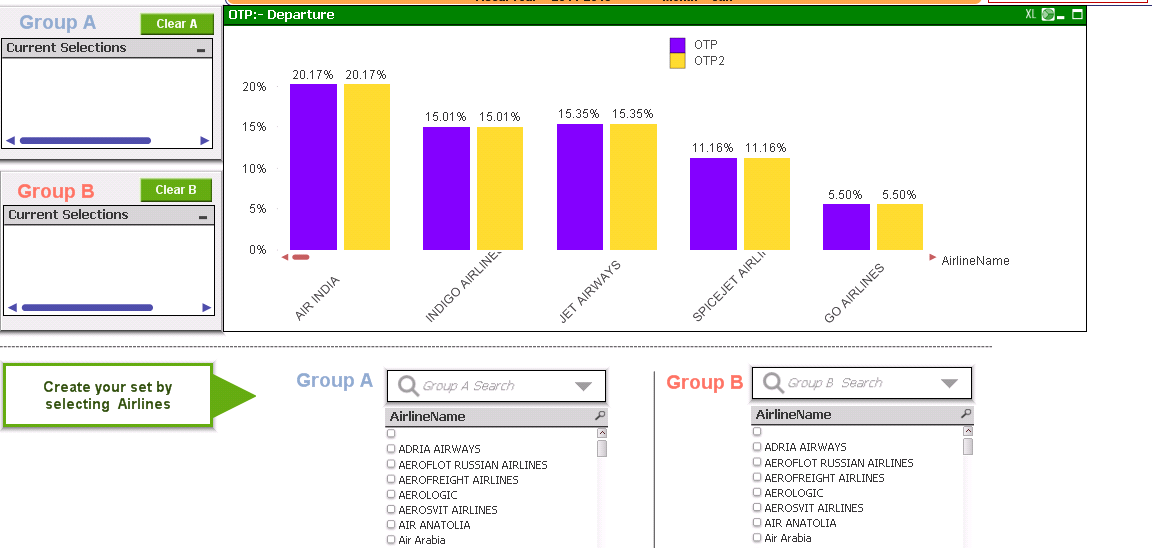
i want to compare more than one airline on the basis of One time performance (i.e> which depart at per schedule time) for which i have created one bucket having value on-time,15-30 ,30-60,>60
but the problem is if do such analysis i will give the combine result of different group ,but i want if i select 2 airline from group 1 and 1 airline from group 2 ,it should three different bar for different airline
Any suggestion

- Mark as New
- Bookmark
- Subscribe
- Mute
- Subscribe to RSS Feed
- Permalink
- Report Inappropriate Content
Dear ,
If you want to compare three Airlines separately and you need a bar for each airlines
then create another group (Group C) and make a selection from each group.
Thanks,
Mukram
- Mark as New
- Bookmark
- Subscribe
- Mute
- Subscribe to RSS Feed
- Permalink
- Report Inappropriate Content
but the user want to see the comparison between more than 5 /6 ,then it will not work.
Any best for it ,so it can show the comparison between all
- Mark as New
- Bookmark
- Subscribe
- Mute
- Subscribe to RSS Feed
- Permalink
- Report Inappropriate Content
Base on the way you've designed your chart, how do you envisage it to look with what you're trying to achieve?
Perhaps look at bringing the AirlineName as a dimension into the chart?
S.
- Mark as New
- Bookmark
- Subscribe
- Mute
- Subscribe to RSS Feed
- Permalink
- Report Inappropriate Content
Dear,
Can you try to add the Airlinesname as dimension to the chart.
i hope it will work.
Thanks,
Mukram.
- Mark as New
- Bookmark
- Subscribe
- Mute
- Subscribe to RSS Feed
- Permalink
- Report Inappropriate Content
i know that but i want to do it using comparative analysis only
- Mark as New
- Bookmark
- Subscribe
- Mute
- Subscribe to RSS Feed
- Permalink
- Report Inappropriate Content
Dear,
Yes in your existing chart (compartive analysis chart) only add the dimension Airlinesname.
Thanks,
Mukram.
- Mark as New
- Bookmark
- Subscribe
- Mute
- Subscribe to RSS Feed
- Permalink
- Report Inappropriate Content
It won't work,by default will show to 2 bar for same airline
- Mark as New
- Bookmark
- Subscribe
- Mute
- Subscribe to RSS Feed
- Permalink
- Report Inappropriate Content
Dear Shweta ,
Can you attached your sample file.
Thanks,
Mukram
- Mark as New
- Bookmark
- Subscribe
- Mute
- Subscribe to RSS Feed
- Permalink
- Report Inappropriate Content
NO i can't it quite huge app