Unlock a world of possibilities! Login now and discover the exclusive benefits awaiting you.
- Qlik Community
- :
- All Forums
- :
- QlikView App Dev
- :
- Complex formula with calculated dimension
- Subscribe to RSS Feed
- Mark Topic as New
- Mark Topic as Read
- Float this Topic for Current User
- Bookmark
- Subscribe
- Mute
- Printer Friendly Page
- Mark as New
- Bookmark
- Subscribe
- Mute
- Subscribe to RSS Feed
- Permalink
- Report Inappropriate Content
Complex formula with calculated dimension
Hi,
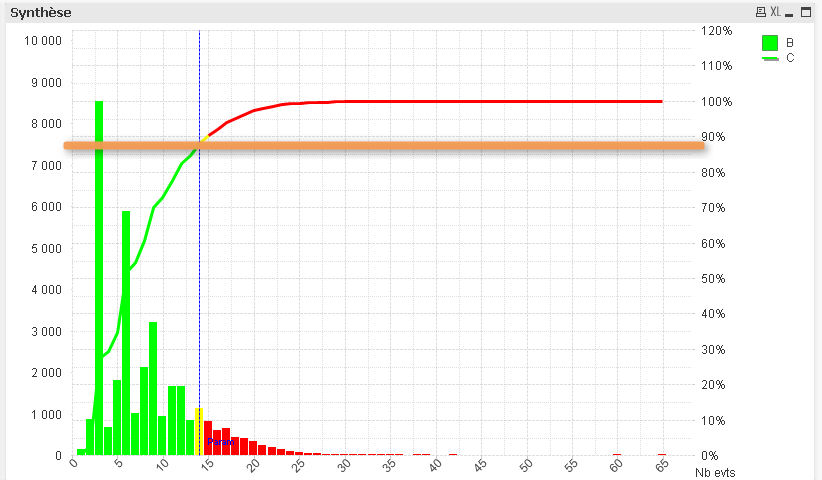
herejoin is an application which is describing the formula to realize.
The only dimension is a calculated one and I just don't succeed in constructing an (complex) expression that work with it.
In the table, column E should contain in each cell the value of column C on the yellow line (88% for PAU)
Column F should contain in each cell the value of the sum of each green and yellow cell of column A (excluding values of red cells) (30 570 for PAU)
The constituted formula should at the end allow to draw the orange line in the graph.

Thanks a lot for your help !
Accepted Solutions
- Mark as New
- Bookmark
- Subscribe
- Mute
- Subscribe to RSS Feed
- Permalink
- Report Inappropriate Content
I resorted to adding a summary table. A calculated dimension can't be used in a set analysis expression, so I created a new field SIMUL_NB_MAX and used that instead. See attached qvw.
talk is cheap, supply exceeds demand