Unlock a world of possibilities! Login now and discover the exclusive benefits awaiting you.
- Qlik Community
- :
- All Forums
- :
- QlikView App Dev
- :
- Conditional Dotted Lines
- Subscribe to RSS Feed
- Mark Topic as New
- Mark Topic as Read
- Float this Topic for Current User
- Bookmark
- Subscribe
- Mute
- Printer Friendly Page
- Mark as New
- Bookmark
- Subscribe
- Mute
- Subscribe to RSS Feed
- Permalink
- Report Inappropriate Content
Conditional Dotted Lines
Hi all,
I have a time series for different ID and values corresponding to it as below:
| ID | Date | Value |
|---|---|---|
| 1 | 21/12/2015 | 6 |
| 1 | 22/12/2015 | 4 |
| 1 | 23/12/2015 | - |
| 1 | 24/12/2015 | - |
| 1 | 25/12/2015 | 8 |
| 2 | 21/12/2015 | - |
| 2 | 22/12/2015 | 1 |
| 2 | 23/12/2015 | 4 |
| 2 | 24/12/2015 | - |
| 2 | 25/12/2015 | 6 |
With the above data, I have to create line chart
with dimension 1: Date
Dimension2: ID
Expression=Value
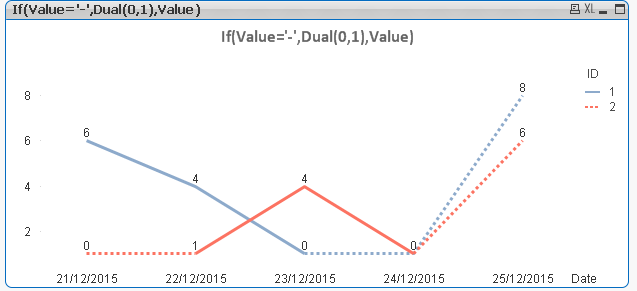
What it gives is:
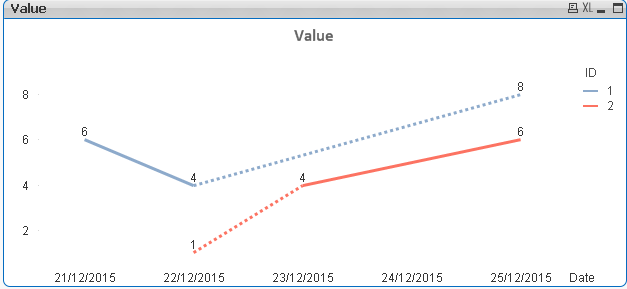
But my requirement is it should start from date 21(ID=2 is not starting) and end at 25
Plus if the data is missing for a particular date then it should be shown with a dotted line (for ID=1 , 23rd and 24th and for ID=2, 21st and 24th).
If value is present then a solid line.
Can anyone help me on this?
Regards,
Anjali Gupta
- Tags:
- new_to_qlikview
Accepted Solutions
- Mark as New
- Bookmark
- Subscribe
- Mute
- Subscribe to RSS Feed
- Permalink
- Report Inappropriate Content
This might not be the best way to do this, as your actually scenario may not match exactly what you have shared, but you can see if this is useful:
Expression:
=If(Date(Min(TOTAL <ID> Date)) = Date and Value = '-', Dual(0,0.00000000001), Sum(Value))
Line Style Expression:
=Aggr(If(Num(Above(Only({<Value -= {'-'}>}Date))) = (Only({<Value -= {'-'}>}Date) - 1) or
If(Date(Min(TOTAL <ID> Date)) = Date and Value = '-', 1, 0) = 1, '<S3>'), ID, Date)
Change in Script: Need to Order by ID, Date so that the Aggr function works properly since Aggr sorts by Load order.
Table:
LOAD ID,
Date,
Value
FROM
[https://community.qlik.com/thread/197912]
(html, codepage is 1252, embedded labels, table is @1);
FinalTable:
NoConcatenate
LOAD *
Resident Table
Order By ID, Date;
DROP Table Table;
- Mark as New
- Bookmark
- Subscribe
- Mute
- Subscribe to RSS Feed
- Permalink
- Report Inappropriate Content
 Like this?
PFA
- Mark as New
- Bookmark
- Subscribe
- Mute
- Subscribe to RSS Feed
- Permalink
- Report Inappropriate Content
Hi treseco,
I don't want the lines to touch 0 for missing data.
The line should be same as that in the pic I have attached with the question.
Only the lines should be dotted for the missing data.
Regards,
Anjali Gupta
- Mark as New
- Bookmark
- Subscribe
- Mute
- Subscribe to RSS Feed
- Permalink
- Report Inappropriate Content
A very slight improvement to your proposed solution since 1 and 0 are coming at the same level.
Use this expression -> If(Value='-',Dual(0,0.0000001),Value)
- Mark as New
- Bookmark
- Subscribe
- Mute
- Subscribe to RSS Feed
- Permalink
- Report Inappropriate Content
Hi Sunny,
As told to treseco, I don't want 0's on the line.
For ID=1,
The line should go from 6 to 4 (solid)and then from 4 to 8 (dotted).
Regards,
Anjali Gupta
- Mark as New
- Bookmark
- Subscribe
- Mute
- Subscribe to RSS Feed
- Permalink
- Report Inappropriate Content
This might not be the best way to do this, as your actually scenario may not match exactly what you have shared, but you can see if this is useful:
Expression:
=If(Date(Min(TOTAL <ID> Date)) = Date and Value = '-', Dual(0,0.00000000001), Sum(Value))
Line Style Expression:
=Aggr(If(Num(Above(Only({<Value -= {'-'}>}Date))) = (Only({<Value -= {'-'}>}Date) - 1) or
If(Date(Min(TOTAL <ID> Date)) = Date and Value = '-', 1, 0) = 1, '<S3>'), ID, Date)
Change in Script: Need to Order by ID, Date so that the Aggr function works properly since Aggr sorts by Load order.
Table:
LOAD ID,
Date,
Value
FROM
[https://community.qlik.com/thread/197912]
(html, codepage is 1252, embedded labels, table is @1);
FinalTable:
NoConcatenate
LOAD *
Resident Table
Order By ID, Date;
DROP Table Table;
- Mark as New
- Bookmark
- Subscribe
- Mute
- Subscribe to RSS Feed
- Permalink
- Report Inappropriate Content
Well, try line style expression:
=if(not index(concat(total DISTINCT {<Value={'-'}>}Date, ','), Date), '<S3>')

- Mark as New
- Bookmark
- Subscribe
- Mute
- Subscribe to RSS Feed
- Permalink
- Report Inappropriate Content
Hi Treseco still its not working for me... ![]()
- Mark as New
- Bookmark
- Subscribe
- Mute
- Subscribe to RSS Feed
- Permalink
- Report Inappropriate Content
Can you expand 'not working' ? Are you trying it in your actual app and it is not working there? The attachment I shared is not ok?