Unlock a world of possibilities! Login now and discover the exclusive benefits awaiting you.
- Qlik Community
- :
- All Forums
- :
- QlikView App Dev
- :
- Conditional Expression
- Subscribe to RSS Feed
- Mark Topic as New
- Mark Topic as Read
- Float this Topic for Current User
- Bookmark
- Subscribe
- Mute
- Printer Friendly Page
- Mark as New
- Bookmark
- Subscribe
- Mute
- Subscribe to RSS Feed
- Permalink
- Report Inappropriate Content
Conditional Expression
Hi Friends
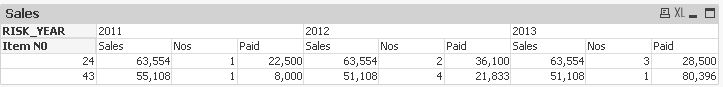
| RISK_YEAR | 2011 | 2012 | 2013 | ||||||
| Item N0 | Sales | Nos | Paid | Sales | Nos | Paid | Sales | Nos | Paid |
| 22 | - | - | - | 12,578 | 1 | 1,400 | - | - | - |
| 23 | 65,777 | 2 | 138,982 | - | - | - | - | - | - |
| 24 | 63,554 | 1 | 22,500 | 63,554 | 2 | 36,100 | 63,554 | 3 | 28,500 |
| 25 | - | - | - | - | - | - | 26,805 | 1 | 6,200 |
| 26 | - | - | - | 62,255 | 1 | 12,500 | - | - | - |
| 41 | 10,596 | 1 | 4,800 | - | - | - | - | - | - |
| 42 | - | - | - | - | 1 | 37,000 | - | 1 | 29,800 |
| 43 | 55,108 | 1 | 8,000 | 51,108 | 4 | 21,833 | 51,108 | 1 | 80,396 |
In my above pivot table I have all data in display. But I want to dis only records highlighted in red. in other words all records where all columns have figures. Pls help me to solve this problem
Thanks
Accepted Solutions
- Mark as New
- Bookmark
- Subscribe
- Mute
- Subscribe to RSS Feed
- Permalink
- Report Inappropriate Content
Hi upali,
one possible solution could be:
SET minimum3 = if($1<$2 AND $1<$3, $1, if($2<$1 AND $2<$3, $2, $3));
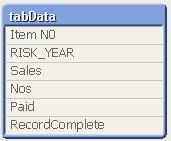
tabData:
LOAD [Item N0],
RISK_YEAR,
Sales,
Nos,
Paid
FROM
[http://community.qlik.com/thread/112511]
(html, codepage is 1252, embedded labels, table is @2);
tabTemp:
LOAD
[Item N0],
$(minimum3(CountSales, CountNos, CountPaid)) as MinCount;
LOAD
[Item N0],
Sum(IsNum(Sales))*-1 as CountSales,
Sum(IsNum(Nos))*-1 as CountNos,
Sum(IsNum(Paid))*-1 as CountPaid
Resident tabData
Group By [Item N0];
Left Join (tabTemp)
LOAD
Count(DISTINCT RISK_YEAR) as RiskYearCount
Resident tabData;
Left Join (tabData)
LOAD Distinct
[Item N0],
MinCount >= RiskYearCount as RecordComplete
Resident tabTemp;
DROP Table tabTemp;
This solution takes into account that not only the distinct number of RISK_YEARs per Item No decides whether the records for this Item No are complete or not. In your example there are rows with missing sales values which I also wanted to count for this check.
Hope this helps
regards
Marco
- Mark as New
- Bookmark
- Subscribe
- Mute
- Subscribe to RSS Feed
- Permalink
- Report Inappropriate Content
Hi.
There are different ways.
You can modify the data model to calculate the flag for each Item in script (one additional load with group by statement). Then use it in your expressions:
Sum({<[Item all years]={1}>} Sales)
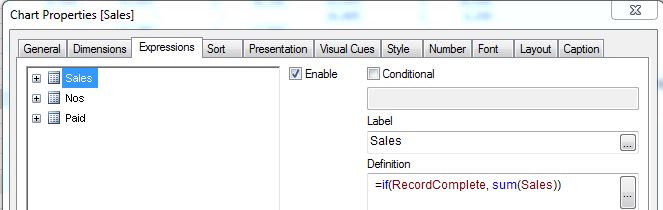
Or you can use set analysis in your expressions to omit the unnecessary Items.
Depending on your data model, the set expression to keep these items could be:
Sales: Sum({<[Item N0]={'=Count(distinct RISK_YEAR)=3'}>} Sales)
Or you can use the same logic as above using calculated dimension instead of Item N0. It's useful when you don't want modify each expression but can be less performance effective.
- Mark as New
- Bookmark
- Subscribe
- Mute
- Subscribe to RSS Feed
- Permalink
- Report Inappropriate Content
Thanks Whiteline
"You can modify the data model to calculate the flag for each Item in script (one additional load with group by statement)."
I do not understand above part can you write the sample script for me please
- Mark as New
- Bookmark
- Subscribe
- Mute
- Subscribe to RSS Feed
- Permalink
- Report Inappropriate Content
LOAD
[Item N0],
Count(distinct RISK_YEAR)=3 as [Item all years]
Resident DataTable
Group by [Item N0];
- Mark as New
- Bookmark
- Subscribe
- Mute
- Subscribe to RSS Feed
- Permalink
- Report Inappropriate Content
Table for script tests:
| Item N0 | RISK_YEAR | Sales | Nos | Paid |
|---|---|---|---|---|
| 22 | 2011 | - | - | - |
| 23 | 2011 | 65,777 | 2 | 138,982 |
| 24 | 2011 | 63,554 | 1 | 22,500 |
| 25 | 2011 | - | - | - |
| 26 | 2011 | - | - | - |
| 41 | 2011 | 10,596 | 1 | 4,800 |
| 42 | 2011 | - | - | - |
| 43 | 2011 | 55,108 | 1 | 8,000 |
| 22 | 2012 | 12,578 | 1 | 1,400 |
| 23 | 2012 | - | - | - |
| 24 | 2012 | 63,554 | 2 | 36,100 |
| 25 | 2012 | - | - | - |
| 26 | 2012 | 62,255 | 1 | 12,500 |
| 41 | 2012 | - | - | - |
| 42 | 2012 | - | 1 | 37,000 |
| 43 | 2012 | 51,108 | 4 | 21,833 |
| 22 | 2013 | - | - | - |
| 23 | 2013 | - | - | - |
| 24 | 2013 | 63,554 | 3 | 28,500 |
| 25 | 2013 | 26,805 | 1 | 6,200 |
| 26 | 2013 | - | - | - |
| 41 | 2013 | - | - | - |
| 42 | 2013 | - | 1 | 29,800 |
| 43 | 2013 | 51,108 | 1 | 80,396 |
- Mark as New
- Bookmark
- Subscribe
- Mute
- Subscribe to RSS Feed
- Permalink
- Report Inappropriate Content
Hi upali,
one possible solution could be:
SET minimum3 = if($1<$2 AND $1<$3, $1, if($2<$1 AND $2<$3, $2, $3));

tabData:
LOAD [Item N0],
     RISK_YEAR,
     Sales,
     Nos,
     Paid
FROM
[http://community.qlik.com/thread/112511]
(html, codepage is 1252, embedded labels, table is @2);

tabTemp:
LOAD
  [Item N0],
  $(minimum3(CountSales, CountNos, CountPaid)) as MinCount;
LOAD
  [Item N0],
  Sum(IsNum(Sales))*-1 as CountSales,
  Sum(IsNum(Nos))*-1 as CountNos,
  Sum(IsNum(Paid))*-1 as CountPaid
Resident tabData
Group By [Item N0];

Left Join (tabTemp)
LOAD
  Count(DISTINCT RISK_YEAR) as RiskYearCount
Resident tabData;

Left Join (tabData)
LOAD Distinct
  [Item N0],
  MinCount >= RiskYearCount as RecordComplete
Resident tabTemp;

DROP Table tabTemp;
This solution takes into account that not only the distinct number of RISK_YEARs per Item No decides whether the records for this Item No are complete or not. In your example there are rows with missing sales values which I also wanted to count for this check.
Hope this helps
regards
Marco