Unlock a world of possibilities! Login now and discover the exclusive benefits awaiting you.
- Qlik Community
- :
- All Forums
- :
- QlikView App Dev
- :
- Re: Conditional Formatting of Bar Charts based on ...
- Subscribe to RSS Feed
- Mark Topic as New
- Mark Topic as Read
- Float this Topic for Current User
- Bookmark
- Subscribe
- Mute
- Printer Friendly Page
- Mark as New
- Bookmark
- Subscribe
- Mute
- Subscribe to RSS Feed
- Permalink
- Report Inappropriate Content
Conditional Formatting of Bar Charts based on Threshold Criteria
Let's say you have a bar chart and the bars must be green or red base on whether the are <= to the goal, or > than the goal. Here are the conditions:
Green if <= to the goal
Red if > than the goal
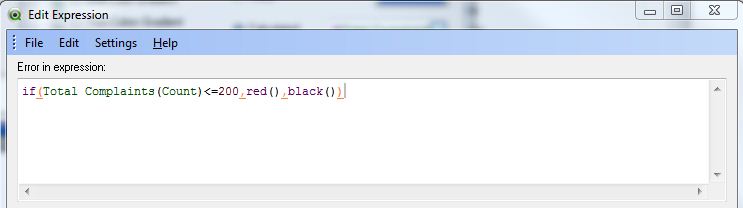
Is there a way to do this? I tried Chart Properties, than I click on the Color 1 in the Data Appearance color index, and selected "Calculated" under base color. My calculation looks like this: what am I missing?
Accepted Solutions
- Mark as New
- Bookmark
- Subscribe
- Mute
- Subscribe to RSS Feed
- Permalink
- Report Inappropriate Content
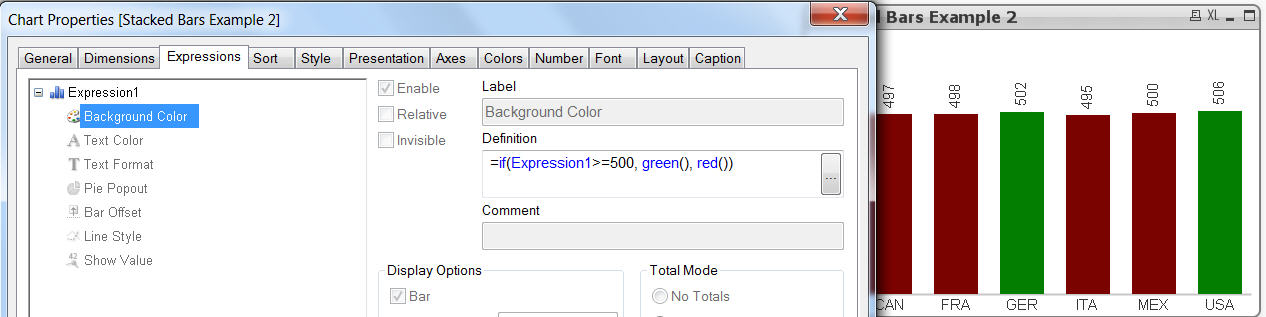
Try referring to the expression by its name or Column(Number). In my example, my Expression was called "Expression1"
=if(Expression1>=500, green(), red())
- Mark as New
- Bookmark
- Subscribe
- Mute
- Subscribe to RSS Feed
- Permalink
- Report Inappropriate Content
In the expressions tab, clic on the + sign to expand next to the expression
In the back color option insert your condition
if(Count(Total) <= goal, green(), red())
- Mark as New
- Bookmark
- Subscribe
- Mute
- Subscribe to RSS Feed
- Permalink
- Report Inappropriate Content
try to use the expression attributes, namely the background color attribute instead.
Go to expression tab, open the attributes by clicking on the plus sign next to your chart expression.
enter a color expression for background color:
=if(count(total Complaints)<=200, red(), black())
The count(total Complaints) should return the left side of your condition, should also just return a number as normal expression.
Regards,
Stefan
- Mark as New
- Bookmark
- Subscribe
- Mute
- Subscribe to RSS Feed
- Permalink
- Report Inappropriate Content

Thank you. What I have now is the condition in place, however, I am getting green for both bars when I the one on the left should be red and the one on the right should be green. Anything standing out to you?
I set the threshold number (goal) manually in the expression to 200. The number on the left bar is 316, the number on the right bar is 178.
- Mark as New
- Bookmark
- Subscribe
- Mute
- Subscribe to RSS Feed
- Permalink
- Report Inappropriate Content
Instead of Count, name your expression diferently (Count is a reserved word).
For instance, "Complaints Count"
In the background color, use
if([Complaints Count] <= 200, green(), red())
- Mark as New
- Bookmark
- Subscribe
- Mute
- Subscribe to RSS Feed
- Permalink
- Report Inappropriate Content
Try referring to the expression by its name or Column(Number). In my example, my Expression was called "Expression1"
=if(Expression1>=500, green(), red())
- Mark as New
- Bookmark
- Subscribe
- Mute
- Subscribe to RSS Feed
- Permalink
- Report Inappropriate Content
PROBLEM SOLVED
Both correct answers! Thanks, wonderful help and SOOO fast. I'm amazed. Thanks again.
- Mark as New
- Bookmark
- Subscribe
- Mute
- Subscribe to RSS Feed
- Permalink
- Report Inappropriate Content
Hi
As a further step for this question, I have an other one.
In my chart i want the bars to have three different colors.
Expression result: 0 to 70 Red, 70(71) to 90 Yellow and 90(91) to 100 Green.
Is this possible to do in the Background color attribute?
Best regards
/Mats