Unlock a world of possibilities! Login now and discover the exclusive benefits awaiting you.
- Qlik Community
- :
- All Forums
- :
- QlikView App Dev
- :
- Conditional colors question
- Subscribe to RSS Feed
- Mark Topic as New
- Mark Topic as Read
- Float this Topic for Current User
- Bookmark
- Subscribe
- Mute
- Printer Friendly Page
- Mark as New
- Bookmark
- Subscribe
- Mute
- Subscribe to RSS Feed
- Permalink
- Report Inappropriate Content
Conditional colors question
Hoi there,
A lot of you will know the problem, when you reload, the colors of your chart might change.
A solution to this is writing a script for the colors.
O.a =If(V001='Immediately,' Green(), If(V001='After more than 3 tiries', Red(), If(....etcetera))
Now i have made this Pie graph. The big pie shows the selection, the small pie shows the total at all times (using the {1} in the count)
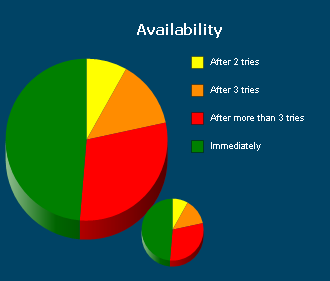
The colorscript works fine for the big one. However, I do not manage to write the color script for the small one in that way the for the small graph the colors stay the same (although using the {1} function in the expression)
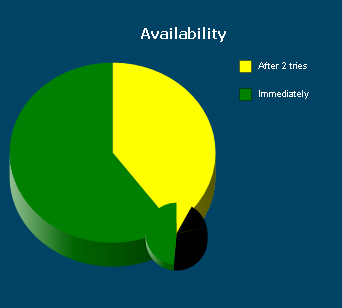
What's the problem? Whenever I make a selection the small graph only shows the colors of the selection.
The idea is that the small graph does not change at ALL. I guess I'll have to use the {1} in my color script as well.
However, I don't know how to do that.
Any suggestions on this one?
Kind regards,
Tim Dries
Accepted Solutions
- Mark as New
- Bookmark
- Subscribe
- Mute
- Subscribe to RSS Feed
- Permalink
- Report Inappropriate Content
Try using:
=If( only({1} V001) ='Immediately,' Green(), If(only({1} V001) ='After more than 3 tiries', Red(), If(....etcetera))
And I would suggest creating a color field in your data model, so you don't need the if() clauses in each chart.
Regards,
Stefan
- Mark as New
- Bookmark
- Subscribe
- Mute
- Subscribe to RSS Feed
- Permalink
- Report Inappropriate Content
See if this link helps
- Mark as New
- Bookmark
- Subscribe
- Mute
- Subscribe to RSS Feed
- Permalink
- Report Inappropriate Content
See if this link helps
- Mark as New
- Bookmark
- Subscribe
- Mute
- Subscribe to RSS Feed
- Permalink
- Report Inappropriate Content
Try using:
=If( only({1} V001) ='Immediately,' Green(), If(only({1} V001) ='After more than 3 tiries', Red(), If(....etcetera))
And I would suggest creating a color field in your data model, so you don't need the if() clauses in each chart.
Regards,
Stefan
- Mark as New
- Bookmark
- Subscribe
- Mute
- Subscribe to RSS Feed
- Permalink
- Report Inappropriate Content
Thanks man!
That was what I was looking for!
However, I'll take your advice with me will give the color field a change!
kind regards,
Tim