Unlock a world of possibilities! Login now and discover the exclusive benefits awaiting you.
- Qlik Community
- :
- All Forums
- :
- QlikView App Dev
- :
- Re: Conditional colours for Scatter Chart dots abo...
- Subscribe to RSS Feed
- Mark Topic as New
- Mark Topic as Read
- Float this Topic for Current User
- Bookmark
- Subscribe
- Mute
- Printer Friendly Page
- Mark as New
- Bookmark
- Subscribe
- Mute
- Subscribe to RSS Feed
- Permalink
- Report Inappropriate Content
Conditional colours for Scatter Chart dots above and Below the Line
Hi Folks,
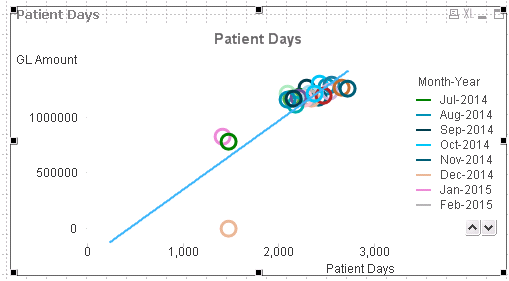
I am wanting to colour the chart below as follows:
Above the Linear Line - Blue
Below the Linear Line - Red
Current Month - Green
Any suggestions on the formula to use in the Colour Definitions would be greatly appreciated.

- Tags:
- scatter chart
- Mark as New
- Bookmark
- Subscribe
- Mute
- Subscribe to RSS Feed
- Permalink
- Report Inappropriate Content
Hi Rean,
Try this:
If
(
"Expresion Llinear Line">''Value" and Month='month(today())',
rgb(10,245,10),
if
(
"Expresion Llinear Line">''Value",
rgb(80,160,240),
rgb(255,0,0)
)
)
Regards
Miguel del Valle
- Mark as New
- Bookmark
- Subscribe
- Mute
- Subscribe to RSS Feed
- Permalink
- Report Inappropriate Content
Hi Rean,
try out this, it should work.
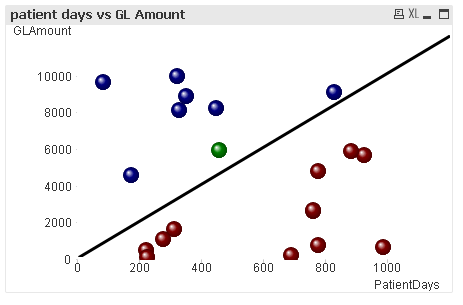
1. calculate formula for the reference line
2. use background colour of 1st dimension to define colour and insert formula (if everything fails define fixed axis).
3. for the reference line, I used just an overlay line on the bottom 😉

Formula for the colour in my case is
=if (
MonthStart(Date)=MonthStart(Today()),green(),
if(
GLAmount>=PatientDays*10,blue(),red()
)
)
If anybody tells me how to add an attachment here, I can post the qvw, too.
Keep Qliking
Michael
- Mark as New
- Bookmark
- Subscribe
- Mute
- Subscribe to RSS Feed
- Permalink
- Report Inappropriate Content
Thanks both, it was actually the method for calculating the reference line I was mainly after, which I think is uses the "Linest" function.
- Mark as New
- Bookmark
- Subscribe
- Mute
- Subscribe to RSS Feed
- Permalink
- Report Inappropriate Content
Hi Rean,
as you seem to need a linear trendline and not just a diagonal line there is the problem that you have to display a line function inside a scatter chart.
To be honest, I have no clue how this should work, even with the reference line.
So the way out is a second line chart with the same axis, invisible apart from the line itself in the background.
1. calculate formula for the reference line via linest...()
2. use background color of 1st dimension to define color and insert formula
3. Fix axis to max +10%
4. for the reference line, create separate line chart with same fixed axis
5. put underneath and synchronize using "show grid".
6. when all fits, make all colors of the line chart transparent except for the trend line
-> note that the colors and trendline will react on selections, too
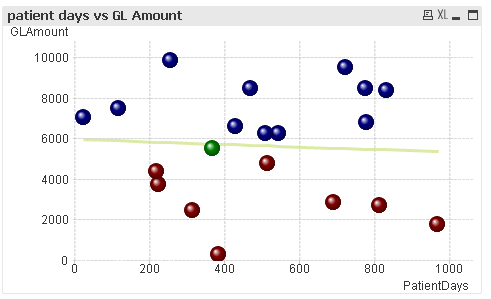
And this is the revised formula for the colours:
=if (
MonthStart(Date)=MonthStart(Today()),green(),
if(
GLAmount>=(PatientDays*vM)+vB,blue(),red()
)
)
while vM is linest_m() and vB is linest_b()
and that's how it looks:

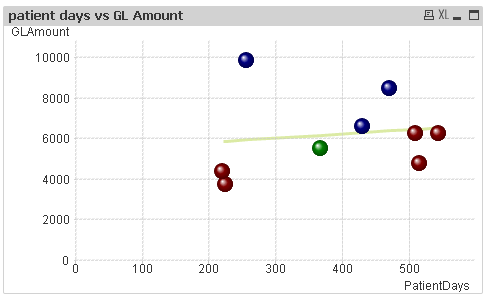
and with a selction it changes e.g. to

Alternatively to avoid all this mess with the synchronized charts, you could as well use a line chart with just symbols instead. The problem with potentially not unique y-values can be solved by adding a really small random value to the x-values while loading.
e.g.
LOAD
PatientDays + (Rand()/100000) as PatientDays ,
GLAmount,
Date
...
Then you can simply add a linear trendline for your first expression only(GLAmount ) where you wont even need the linest()
or create any other calculated reference line as a second expression.
If you want the date to be shown too, just add another expression only(Date) and tick "text as popup".
Downside of this dirty little trick: I have no idea how to erase the delta for display. In my version no rounding or number formatting helps.
Hope it helped
Michael