Unlock a world of possibilities! Login now and discover the exclusive benefits awaiting you.
- Qlik Community
- :
- All Forums
- :
- QlikView App Dev
- :
- Re: Conditional display of text boxes based on the...
- Subscribe to RSS Feed
- Mark Topic as New
- Mark Topic as Read
- Float this Topic for Current User
- Bookmark
- Subscribe
- Mute
- Printer Friendly Page
- Mark as New
- Bookmark
- Subscribe
- Mute
- Subscribe to RSS Feed
- Permalink
- Report Inappropriate Content
Conditional display of text boxes based on the number of years in a bar chart
Hi,
I have a bar chart displaying 3 years of data 2014,2015 and 2016. And YOY% are displayed between the bars in a text box.
Condition here is when there is data for all the 3 years then only text boxes has to be displayed.
See below screenshot
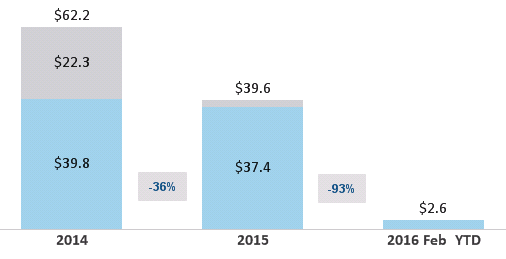
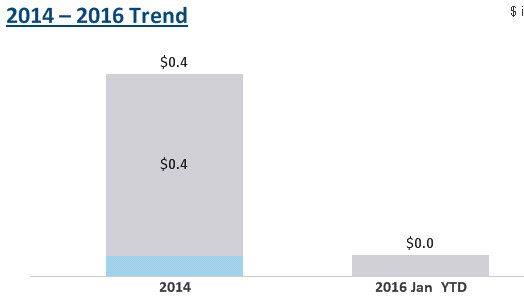
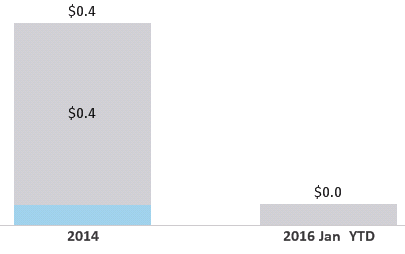
When data is there only for 1 or 2 years the text boxes should not be displayed.
To achieve this I wrote a conditional show statement under Layout 'count(DISTINCT(Year)) >2'. But this is not hiding the text boxes.
If you see in below screenshot, textboxes are overlapping with the bars.

Note: There are no year filters available in the dashboard
Can someone please help me hide these textboxes when 3 years of data is not available.
Thanks!
- Mark as New
- Bookmark
- Subscribe
- Mute
- Subscribe to RSS Feed
- Permalink
- Report Inappropriate Content
yes please..
- Mark as New
- Bookmark
- Subscribe
- Mute
- Subscribe to RSS Feed
- Permalink
- Report Inappropriate Content
Can you check:
- Mark as New
- Bookmark
- Subscribe
- Mute
- Subscribe to RSS Feed
- Permalink
- Report Inappropriate Content
Thanks much!
One last thing, can you please help me write an expression for the below situation.
Display 1 text box when 2 alternate years data is available.
Thanks a lot for your time!
- Mark as New
- Bookmark
- Subscribe
- Mute
- Subscribe to RSS Feed
- Permalink
- Report Inappropriate Content
Can you share a sample where this is true?
- Mark as New
- Bookmark
- Subscribe
- Mute
- Subscribe to RSS Feed
- Permalink
- Report Inappropriate Content
Attached qvw to my original post.
- Mark as New
- Bookmark
- Subscribe
- Mute
- Subscribe to RSS Feed
- Permalink
- Report Inappropriate Content
The text box seems to show up, but the number isn't showing
- Mark as New
- Bookmark
- Subscribe
- Mute
- Subscribe to RSS Feed
- Permalink
- Report Inappropriate Content
I will check that.
Thanks again for all your help!
- Mark as New
- Bookmark
- Subscribe
- Mute
- Subscribe to RSS Feed
- Permalink
- Report Inappropriate Content
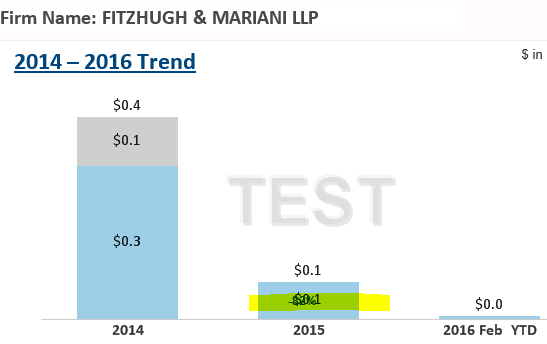
Hi Sunny,
I need your help with the same issue. I have attached the latest qvw to my original post.
Issue: For this firm 2014-2015 YOY% text box is overlapping with the bar and YOY% is not displayed for 2015-2016 YOY%. I tried to modify the expressions you wrote for conditional show but no luck.
Can you please look into this... Thanks!
- Mark as New
- Bookmark
- Subscribe
- Mute
- Subscribe to RSS Feed
- Permalink
- Report Inappropriate Content
Hopefully no more changes will be required. Check out the attached
- Mark as New
- Bookmark
- Subscribe
- Mute
- Subscribe to RSS Feed
- Permalink
- Report Inappropriate Content
Hopefully not
Thanks much for your quick reply!