Unlock a world of possibilities! Login now and discover the exclusive benefits awaiting you.
- Qlik Community
- :
- All Forums
- :
- QlikView App Dev
- :
- Re: Convert number in days and hours
- Subscribe to RSS Feed
- Mark Topic as New
- Mark Topic as Read
- Float this Topic for Current User
- Bookmark
- Subscribe
- Mute
- Printer Friendly Page
- Mark as New
- Bookmark
- Subscribe
- Mute
- Subscribe to RSS Feed
- Permalink
- Report Inappropriate Content
Convert number in days and hours
Hello everyone, I have a problem and quisiser know if I can help get the following information:
My |
| AVG T. Atención | AVG |
12890 |
| ||
one | 2172 |
| |
feb | 3713 |
| |
mar | 2595 |
| |
abr | 2137 |
| |
may | 1759 |
| |
jun | 514 |
|
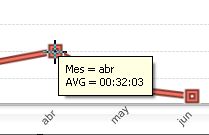
And the problem in April to spend this time in excel format gives me 1 day with 32 minutes of this form
My |
| AVG T. Atención | AVG |
12890 |
| 00: 10: 36: 11 | |
one | 2172 |
| 00: 10: 06: 06 |
feb | 3713 |
| 00: 10: 03: 45 |
mar | 2595 |
| 00: 08: 45: 06 |
abr | 2137 |
| 01: 00: 32: 03 |
may | 1759 |
| 00: 01: 06: 04 |
jun | 514 |
| 00: 00: 34: 07 |
I wonder if I can do it in graphic QlikView because if this is wrong and gives me a gráica of attention tiempode wrong, but wrong gives me a pop just to 32 minutes and this causes confusion
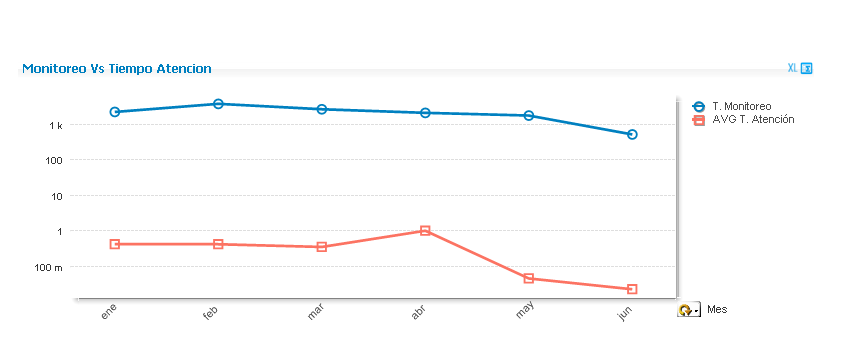
And I'd like to leave 1 days 32 minutes of attention.
I hope you can help me.
- Tags:
- new_to_qlikview
- Mark as New
- Bookmark
- Subscribe
- Mute
- Subscribe to RSS Feed
- Permalink
- Report Inappropriate Content
How do I know if the circled part is Day 01? Do you have a start and end date somewhere which is doing the calculation?
- Mark as New
- Bookmark
- Subscribe
- Mute
- Subscribe to RSS Feed
- Permalink
- Report Inappropriate Content
Hello Sunny,
Well first i do this in the script, there are two rows;
FECHA_ASIGN-FECHA_AP as TiempoAten
Then i calculate from the graphic whit this
avg({$<BUZON={'MONITOREO*'}>}TiempoAten)
This is the calculation, buth i see the day 01 when i export the data to Excel, i can´t see in ClikView before that.
Thanks
- Mark as New
- Bookmark
- Subscribe
- Mute
- Subscribe to RSS Feed
- Permalink
- Report Inappropriate Content
Hi,
you could change the number format of your AVG expression from time to interval:
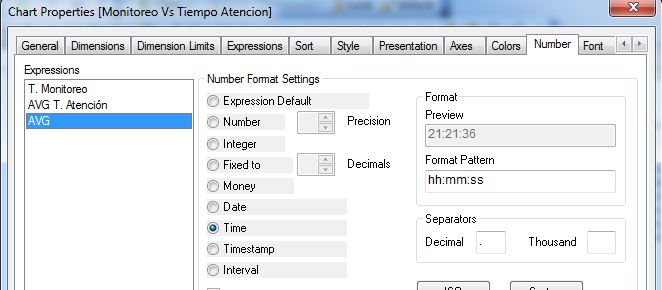
hope this helps
regards
Marco
- Mark as New
- Bookmark
- Subscribe
- Mute
- Subscribe to RSS Feed
- Permalink
- Report Inappropriate Content
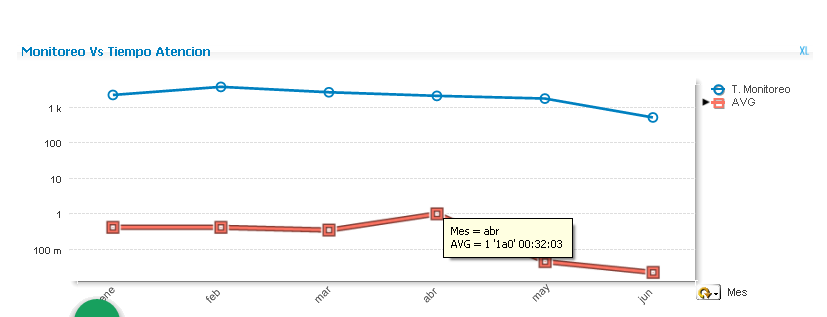
Hi,
Is this your expected output??. Sorry if i'm wrong.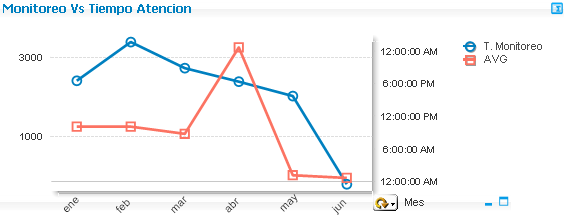
- Mark as New
- Bookmark
- Subscribe
- Mute
- Subscribe to RSS Feed
- Permalink
- Report Inappropriate Content
Hi Marco,
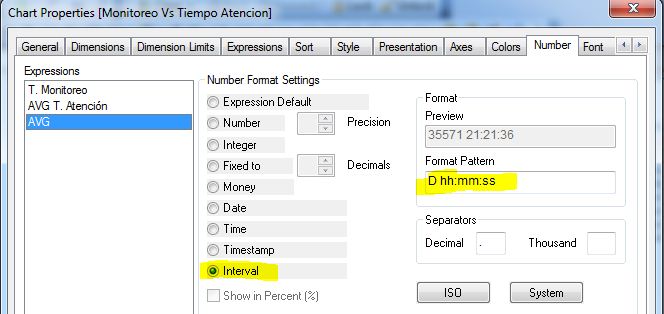
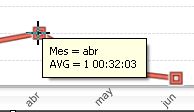
Thanks for your hellp, it´s exactly what i want, only one more question, if i want to put in the emergent
like AVG = 1 day 00:32:03, in te format of interval i put some like D 'day' hh:mm:ss but the result is
Regards
Josué
- Mark as New
- Bookmark
- Subscribe
- Mute
- Subscribe to RSS Feed
- Permalink
- Report Inappropriate Content
Hi Krishna,
Yes, this is the output, the problem is the emergent, but Marco give me the correct answer.
Regards.
Josué
- Mark as New
- Bookmark
- Subscribe
- Mute
- Subscribe to RSS Feed
- Permalink
- Report Inappropriate Content
Hi,
Is your exact O/P which i gave the screen shot ???
- Mark as New
- Bookmark
- Subscribe
- Mute
- Subscribe to RSS Feed
- Permalink
- Report Inappropriate Content
Hi,
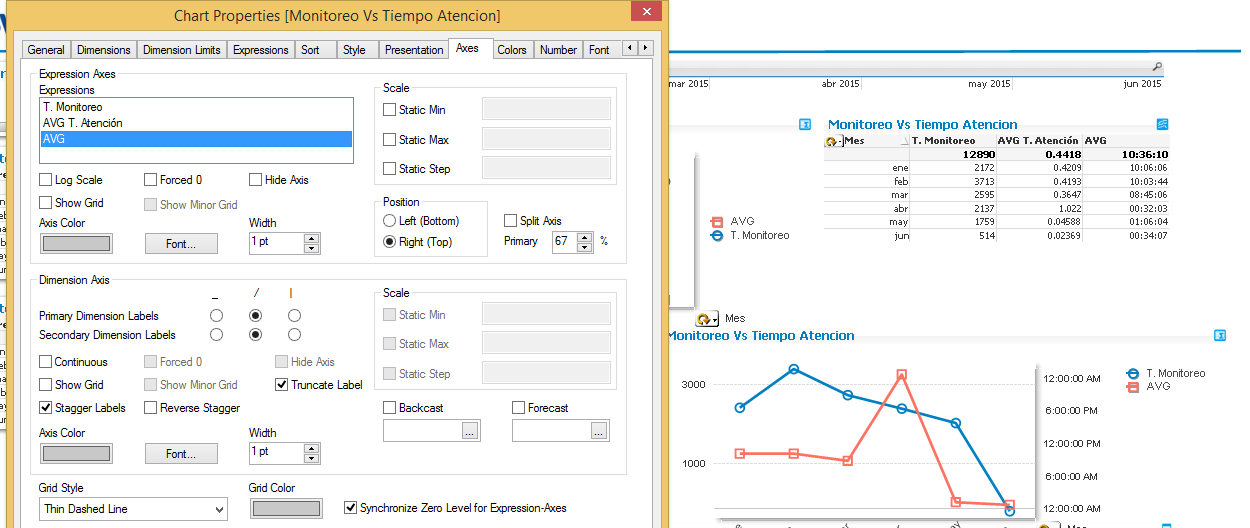
If the above one is your exact output.To achieve this ,Go to properties of chart -> Axes->
Select your Expression (AVG)-> Select Position Right (Top)
- Mark as New
- Bookmark
- Subscribe
- Mute
- Subscribe to RSS Feed
- Permalink
- Report Inappropriate Content
Thanks Krishna
- Mark as New
- Bookmark
- Subscribe
- Mute
- Subscribe to RSS Feed
- Permalink
- Report Inappropriate Content
The 'd' and 'y' characters are treated as interval formats, i.e. are displayed as day and year numbers.
One possibility could be to change the AVG number format to "expression default" and the AVG expression itself to:
=Dual(
      SubField(Interval(Avg({$<BUZON={'MONITOREO*'}>}TiempoAten),'D hh:mm:ss'),' ',1)
      &' days '&
      SubField(Interval(Avg({$<BUZON={'MONITOREO*'}>}TiempoAten),'D hh:mm:ss'),' ',2)
      ,
      Avg({$<BUZON={'MONITOREO*'}>}TiempoAten)
    )
hope this helps
regards
Marco