Unlock a world of possibilities! Login now and discover the exclusive benefits awaiting you.
- Qlik Community
- :
- All Forums
- :
- QlikView App Dev
- :
- Re: Count Avg from Chart
- Subscribe to RSS Feed
- Mark Topic as New
- Mark Topic as Read
- Float this Topic for Current User
- Bookmark
- Subscribe
- Mute
- Printer Friendly Page
- Mark as New
- Bookmark
- Subscribe
- Mute
- Subscribe to RSS Feed
- Permalink
- Report Inappropriate Content
Count Avg from Chart
Hi, everyone.
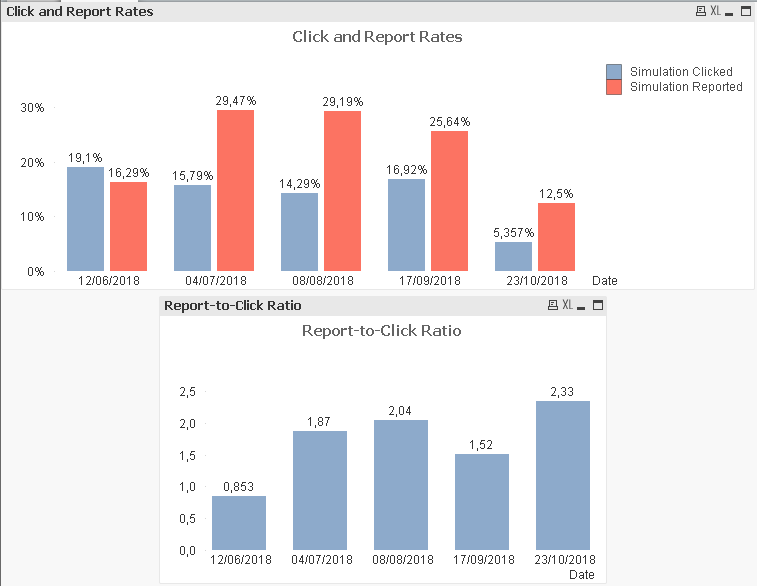
I have 2 charts like this :

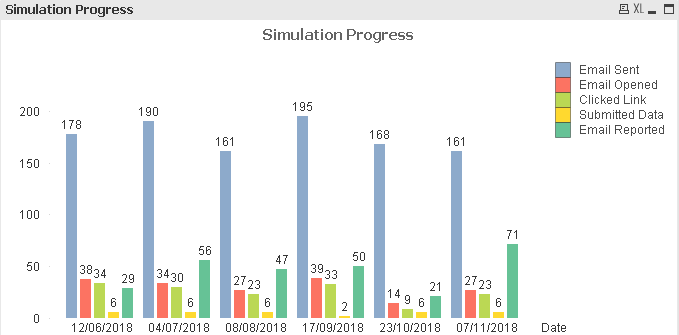
Those 2 charts are the result of computation from this chart :

What I want to ask is, how can I count the average over 5 months of Simulation Clicked and Report-to-Click Ratio ?
Any answer would be greatly appreciated
Thank you
- Kevin
Accepted Solutions
- Mark as New
- Bookmark
- Subscribe
- Mute
- Subscribe to RSS Feed
- Permalink
- Report Inappropriate Content
Whatever your expression is to create the bar chart, you will need to use the aggr function to aggregate by the dimension in your chart.
If your dimension is month, then it would look like this:
Avg(Aggr(........... , Month))
- Mark as New
- Bookmark
- Subscribe
- Mute
- Subscribe to RSS Feed
- Permalink
- Report Inappropriate Content
Great !
Beside that, can you help to make a summary table from Click & Report Rates and Report-to-Click Ratio charts ?
- Mark as New
- Bookmark
- Subscribe
- Mute
- Subscribe to RSS Feed
- Permalink
- Report Inappropriate Content
You could either copy and paste and convert to a table or toggle between the two using the Fast change option.