Unlock a world of possibilities! Login now and discover the exclusive benefits awaiting you.
- Qlik Community
- :
- All Forums
- :
- QlikView App Dev
- :
- Re: Count Distinct Exclude Total Row
- Subscribe to RSS Feed
- Mark Topic as New
- Mark Topic as Read
- Float this Topic for Current User
- Bookmark
- Subscribe
- Mute
- Printer Friendly Page
- Mark as New
- Bookmark
- Subscribe
- Mute
- Subscribe to RSS Feed
- Permalink
- Report Inappropriate Content
Count Distinct Exclude Total Row
I have a chart with a total row. When I execute the =count(distinct(field name)) the total includes the row with the totals. Is there a way to eliminate the total row in the count? Thanks.
- « Previous Replies
-
- 1
- 2
- Next Replies »
Accepted Solutions
- Mark as New
- Bookmark
- Subscribe
- Mute
- Subscribe to RSS Feed
- Permalink
- Report Inappropriate Content
Hi,
Because of it you are getting 1 extra count.
Either you can subtract 1 manually from your expression or handle null value dimension in your expression
Regards
Please appreciate our Qlik community members by giving Kudos for sharing their time for your query. If your query is answered, please mark the topic as resolved 🙂
- Mark as New
- Bookmark
- Subscribe
- Mute
- Subscribe to RSS Feed
- Permalink
- Report Inappropriate Content
Not sure what you mean, but try this:
Sum(Aggr(Count(DISTINCT FieldName), YourChartDimensions))
- Mark as New
- Bookmark
- Subscribe
- Mute
- Subscribe to RSS Feed
- Permalink
- Report Inappropriate Content
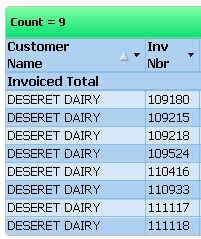
Thanks, but that did not work. Here is an example. There are 8 invoices but the count = 9.
- Mark as New
- Bookmark
- Subscribe
- Mute
- Subscribe to RSS Feed
- Permalink
- Report Inappropriate Content
Is Customer Name and Inv Nbr the only two dimensions in this chart? and when you did this, it did not give you the correct total up-top -> Sum(Aggr(Count(DISTINCT FieldName), [Customer Name], [Inv Nbr]))?
- Mark as New
- Bookmark
- Subscribe
- Mute
- Subscribe to RSS Feed
- Permalink
- Report Inappropriate Content
There are 8 dimensions in the table. I used Sum(Aggr(Count(DISTINCT [Invoice Number]), [Invoice Number])) since I'm trying to determine the invoice count.
- Mark as New
- Bookmark
- Subscribe
- Mute
- Subscribe to RSS Feed
- Permalink
- Report Inappropriate Content
Try the above expression by adding all dimensions in it and see if it gives you the desired output.
- Mark as New
- Bookmark
- Subscribe
- Mute
- Subscribe to RSS Feed
- Permalink
- Report Inappropriate Content
It gave me a count of 20
- Mark as New
- Bookmark
- Subscribe
- Mute
- Subscribe to RSS Feed
- Permalink
- Report Inappropriate Content
Hi,
If you have Primary Key in your data model I suggest count the Primary key.
Like ID sort of
- Mark as New
- Bookmark
- Subscribe
- Mute
- Subscribe to RSS Feed
- Permalink
- Report Inappropriate Content
Share your sample app and data will see whats the issues is
- Mark as New
- Bookmark
- Subscribe
- Mute
- Subscribe to RSS Feed
- Permalink
- Report Inappropriate Content
Hi,
Are you selecting Supress when Value is Null option from dimension tab.
Regards
Please appreciate our Qlik community members by giving Kudos for sharing their time for your query. If your query is answered, please mark the topic as resolved 🙂
- « Previous Replies
-
- 1
- 2
- Next Replies »