Unlock a world of possibilities! Login now and discover the exclusive benefits awaiting you.
- Qlik Community
- :
- All Forums
- :
- QlikView App Dev
- :
- Count Distinct with Set Analysis
- Subscribe to RSS Feed
- Mark Topic as New
- Mark Topic as Read
- Float this Topic for Current User
- Bookmark
- Subscribe
- Mute
- Printer Friendly Page
- Mark as New
- Bookmark
- Subscribe
- Mute
- Subscribe to RSS Feed
- Permalink
- Report Inappropriate Content
Count Distinct with Set Analysis
Hi,
I need some help with an expression of Count Distinct with Set Analysis, anyone can help?
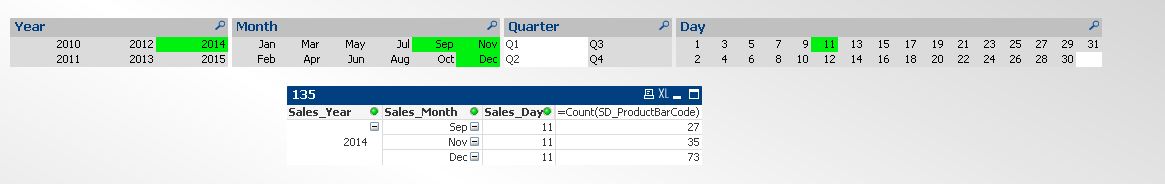
The goal is calculate total number of jobs based on selected period.
For example, if user selects Dec 14, then count total number of jobs for Dec 13
if user selects Oct, Nov and Dec 14, then count total number of jobs for Oct, Nov and Dec 13
Here is my script below, non of them is working. please verify me if I am wrong. Thanks
Solution 1:
=count({$<Date=, Year=, Quarter=, Week=,
Period = {">=$(=monthname(AddYears(min(MC_Period),-1))) <=$(=monthname(AddYears(max(MC_Period),-1)))"}
DISTINCT JobNum)
Solution 2:
=count({<Period=, Date=, Year=, Quarter=,Week=>}if(Period >= vPeriodLYFromMin and Period <= vPeriodLYTo, JobNum,0))
vPeriodLYFromMin = monthname(AddYears(min(MC_Period),-1))
vPeriodLYTo = =monthname(AddYears(max(MC_Period),-1))
- Tags:
- new_to_qlikview
- « Previous Replies
-
- 1
- 2
- Next Replies »
- Mark as New
- Bookmark
- Subscribe
- Mute
- Subscribe to RSS Feed
- Permalink
- Report Inappropriate Content
Hi Derek:
What is 'MC_Period'?
Is that a field in an ad hoc table which is not linked to the data?
Thanks
PC
- Mark as New
- Bookmark
- Subscribe
- Mute
- Subscribe to RSS Feed
- Permalink
- Report Inappropriate Content
Good Day Derek,
Maybe i;m missing the scenario?
But why do you want to make it so complicated with SET ANALYSIS?
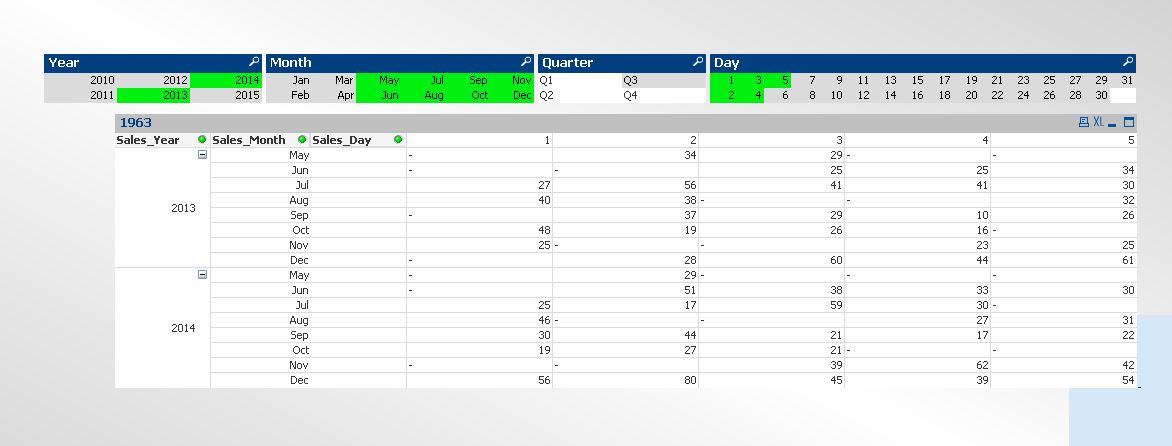
Depending on you data structure you could just use a Pivot Table and Utilize your:
- Year
- Month
- Day
Fields as the dimensions, and simply use the expression of Count(Jobs)
But, like i said, maybe im missing it? Would you mind giving some more info?
I also see you mentioned that the Day you want to calculate is the Day smaller than the selected date? is that a mistake? or is that what you want to achieve?
Rgds,
Nico
- Mark as New
- Bookmark
- Subscribe
- Mute
- Subscribe to RSS Feed
- Permalink
- Report Inappropriate Content
Hi Derek:
Maybe try to transform the periods into numbers (maybe using AutoNum) and then do the comparison.
Using number can also replace the AddYears with simply PeriodNum - 12.
Thanks
- Mark as New
- Bookmark
- Subscribe
- Mute
- Subscribe to RSS Feed
- Permalink
- Report Inappropriate Content
Might make sense to work with rolling monthes (Year * 12 + Monthnum) and then create your expression like
COUNT(${<RollingMonth = {RollingMonth -12}>} Jobs)
HTH Peter
- Mark as New
- Bookmark
- Subscribe
- Mute
- Subscribe to RSS Feed
- Permalink
- Report Inappropriate Content
I think he wants to show the number in text box.
Like this year v.s. last year comparison
- Mark as New
- Bookmark
- Subscribe
- Mute
- Subscribe to RSS Feed
- Permalink
- Report Inappropriate Content
Alternatively,
You could just manipulate your Pivot to get this output??
- Mark as New
- Bookmark
- Subscribe
- Mute
- Subscribe to RSS Feed
- Permalink
- Report Inappropriate Content
tweeked it a little, the main issue with your set analysis is that you are ignoring the "Period" and then trying to use it again, instead create a "Period1" with the same info that "Period" has and add that one inside of the period set, that will work, I also assumed that min is just a date also
Solution 2:
vPeriodLYFromMin = min(MC_Period))
vPeriodLYTo = max(MC_Period)
=count({<Period1 = {'>=$(=(vPeriodLYFromMin))<=$(=(vPeriodLYTo))'}, Period=, Date=, Year=, Quarter=,Week=>} JobNum)
- Mark as New
- Bookmark
- Subscribe
- Mute
- Subscribe to RSS Feed
- Permalink
- Report Inappropriate Content
MC_Period is just Period
Period = MonthName(TempDate)
Derek Cheng
Business Analyst
Toll Global Forwarding
T: +61 3 9982 8066
M: +61 466 525 543
- Mark as New
- Bookmark
- Subscribe
- Mute
- Subscribe to RSS Feed
- Permalink
- Report Inappropriate Content
It is a column in straight table, just want to compare the job number count for current selected period and same period last year.
- « Previous Replies
-
- 1
- 2
- Next Replies »