Unlock a world of possibilities! Login now and discover the exclusive benefits awaiting you.
- Qlik Community
- :
- All Forums
- :
- QlikView App Dev
- :
- Re: Count Error
- Subscribe to RSS Feed
- Mark Topic as New
- Mark Topic as Read
- Float this Topic for Current User
- Bookmark
- Subscribe
- Mute
- Printer Friendly Page
- Mark as New
- Bookmark
- Subscribe
- Mute
- Subscribe to RSS Feed
- Permalink
- Report Inappropriate Content
Count Error
Hi,
i have data like this
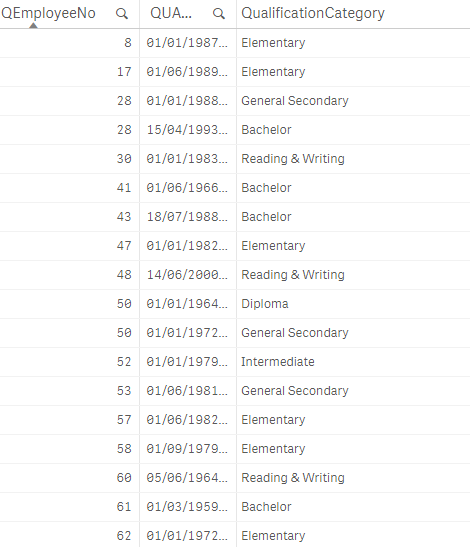
i am taking pie chart
QualificationCatagery as Dimension
and expression like this
=count(If(Aggr(NODISTINCT Max(QualToDate), EmployeeNo) = QualToDate, EmployeeNo))
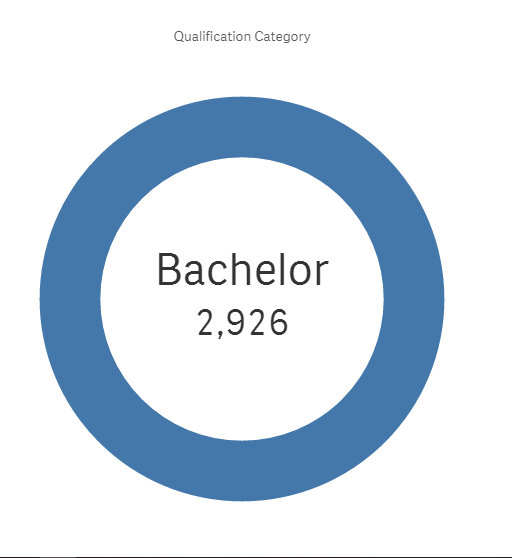
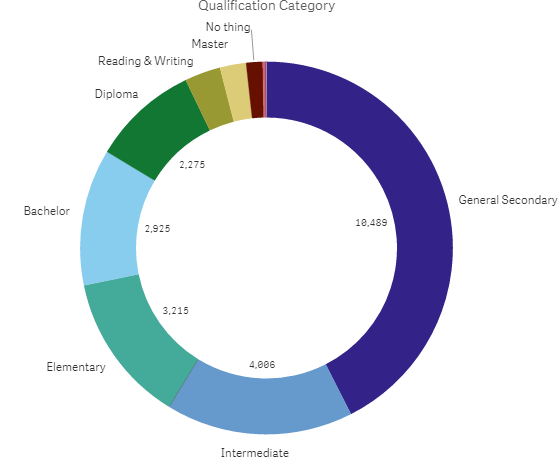
result is coming like this

this values are correct ...
when i select anything like one "Bachelor"
count is coming like this
please help me.
- Mark as New
- Bookmark
- Subscribe
- Mute
- Subscribe to RSS Feed
- Permalink
- Report Inappropriate Content
May be try this
=Count(DISTINCT Aggr(If(Max(TOTAL <EmployeeNo, QualificationCategory> QualToDate) = QualToDate, EmployeeNo), QualificationCategory, EmployeeNo, QualToDate))
- Mark as New
- Bookmark
- Subscribe
- Mute
- Subscribe to RSS Feed
- Permalink
- Report Inappropriate Content
it is showing values like this. even before selection

- Mark as New
- Bookmark
- Subscribe
- Mute
- Subscribe to RSS Feed
- Permalink
- Report Inappropriate Content
Just showing 1 qualificationcategory?
- Mark as New
- Bookmark
- Subscribe
- Mute
- Subscribe to RSS Feed
- Permalink
- Report Inappropriate Content
even full chart showing same result
- Mark as New
- Bookmark
- Subscribe
- Mute
- Subscribe to RSS Feed
- Permalink
- Report Inappropriate Content
and why do you think this number is not correct for Bachelor? Would you be able to share a sample of your app to check this out?
- Mark as New
- Bookmark
- Subscribe
- Mute
- Subscribe to RSS Feed
- Permalink
- Report Inappropriate Content
for example i have 2 emp
emp1 have done bachelor and masters
and
emp2 done only bachelor
if i take pie chart baser on qualification
i will get 1 record under bachelor and i record under masters.
if i click on bachelor dimension in pie chart i will get 2 values because both emp done bachelor
.i want emp with highest qualification. evan i click on qualification dimension did you got it .
in the above chart 2925 is the value which have employees who have done bachelor and other higher qualifications i have to calculate emp highest degree according to QualDate
- Mark as New
- Bookmark
- Subscribe
- Mute
- Subscribe to RSS Feed
- Permalink
- Report Inappropriate Content
How about this then
=Count(DISTINCT Aggr(If(Max(TOTAL <EmployeeNo> QualToDate) = QualToDate, EmployeeNo), QualificationCategory, EmployeeNo, QualToDate))