Unlock a world of possibilities! Login now and discover the exclusive benefits awaiting you.
- Qlik Community
- :
- All Forums
- :
- QlikView App Dev
- :
- Count based on condition
- Subscribe to RSS Feed
- Mark Topic as New
- Mark Topic as Read
- Float this Topic for Current User
- Bookmark
- Subscribe
- Mute
- Printer Friendly Page
- Mark as New
- Bookmark
- Subscribe
- Mute
- Subscribe to RSS Feed
- Permalink
- Report Inappropriate Content
Count based on condition
Hi guys,
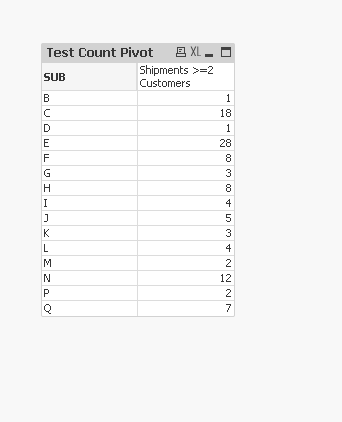
I have a database with Subsidiaries, Shipments and Customers. It is possible that 1 shipment goes to more than 1 customer (milk-run) and I would like to display that. Therefore, I want to count the number of shipments which have more (or equal to) than 2 customers for a subsidiary. In the end, I'd like to have a simple table in QlikView in the following format:
| Subsidiary | Shipments >= 2 Customers |
| A | 5 |
| B | 8 |
| C | 3 |
Any ideas?
Thanks!
- Mark as New
- Bookmark
- Subscribe
- Mute
- Subscribe to RSS Feed
- Permalink
- Report Inappropriate Content
Hi,
Maybe something like this:
Count({<Subsidiary={"Aggr(Count(Distinct Customers), Subsidiary)>=2"}>} Distinct Shipments)
Or you can post sample data which makes it easier to come up with a working syntax.
Thanks
- Mark as New
- Bookmark
- Subscribe
- Mute
- Subscribe to RSS Feed
- Permalink
- Report Inappropriate Content
I would create a new field in the script which combines Subsidiary and Shipment field and use that in my set analysis condition
LOAD Customers,
Subsidiaries,
Shipments,
AutoNumber(Subsidiaries&Shipments, 'Key1') as Key
FROM Source....
and then try this expression:
Count(DISTINCT {<Key = {"=Count(DISTINCT Customers) > 1"}>}Shipments)
- Mark as New
- Bookmark
- Subscribe
- Mute
- Subscribe to RSS Feed
- Permalink
- Report Inappropriate Content
Hi Sinan,
I have attached my database. Preferably, I would like to have the SUB as a Dimension in the Pivot Table and the count as an expression.
Thanks for your help.
- Mark as New
- Bookmark
- Subscribe
- Mute
- Subscribe to RSS Feed
- Permalink
- Report Inappropriate Content
Hey Radu,
Please the attached and let me know if this comes close to what you are looking for.
Thanks
- Mark as New
- Bookmark
- Subscribe
- Mute
- Subscribe to RSS Feed
- Permalink
- Report Inappropriate Content
Hi Sinan,
That is what i am looking for but for some reason it does not count properly. If you look at Subsidiary A, we see 2 shipments with more than 2 customers but that is not true if you check the raw data. Subsidiary A should have 0 shipments with more than 2 customers (or equal).
Thanks,
Radu
- Mark as New
- Bookmark
- Subscribe
- Mute
- Subscribe to RSS Feed
- Permalink
- Report Inappropriate Content
Let's see if this one is correct:
Thanks