Unlock a world of possibilities! Login now and discover the exclusive benefits awaiting you.
Announcements
Join us to spark ideas for how to put the latest capabilities into action. Register here!
- Qlik Community
- :
- All Forums
- :
- QlikView App Dev
- :
- Re: Count cases by number of events
Options
- Subscribe to RSS Feed
- Mark Topic as New
- Mark Topic as Read
- Float this Topic for Current User
- Bookmark
- Subscribe
- Mute
- Printer Friendly Page
Turn on suggestions
Auto-suggest helps you quickly narrow down your search results by suggesting possible matches as you type.
Showing results for
Specialist III
2016-06-22
09:13 AM
- Mark as New
- Bookmark
- Subscribe
- Mute
- Subscribe to RSS Feed
- Permalink
- Report Inappropriate Content
Count cases by number of events
Hi all,
I'd like to reach something but it doesn't works. I have a chart with a Key_ID (dimension) and an expression (=sum(NB_EVENTS)). I want get a count of cases (count Key_ID) for each value expression.
See pictures below:
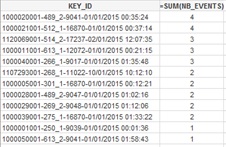
Expected:

Thanks for your answers
Regards
528 Views
1 Solution
Accepted Solutions
MVP
2016-06-22
12:27 PM
- Mark as New
- Bookmark
- Subscribe
- Mute
- Subscribe to RSS Feed
- Permalink
- Report Inappropriate Content
Use a calculated dimension in a straight table chart:
=Aggr( Sum(NB_EVENTS), KEY_ID)
and as expression
=Count(DISTINCT KEY_ID)
2 Replies
MVP
2016-06-22
12:27 PM
- Mark as New
- Bookmark
- Subscribe
- Mute
- Subscribe to RSS Feed
- Permalink
- Report Inappropriate Content
Use a calculated dimension in a straight table chart:
=Aggr( Sum(NB_EVENTS), KEY_ID)
and as expression
=Count(DISTINCT KEY_ID)
Specialist III
2016-06-23
03:18 AM
Author
- Mark as New
- Bookmark
- Subscribe
- Mute
- Subscribe to RSS Feed
- Permalink
- Report Inappropriate Content
It works perfectly!! A great thanks to you.
449 Views