Unlock a world of possibilities! Login now and discover the exclusive benefits awaiting you.
- Qlik Community
- :
- All Forums
- :
- QlikView App Dev
- :
- Re: Count/distinct over time
- Subscribe to RSS Feed
- Mark Topic as New
- Mark Topic as Read
- Float this Topic for Current User
- Bookmark
- Subscribe
- Mute
- Printer Friendly Page
- Mark as New
- Bookmark
- Subscribe
- Mute
- Subscribe to RSS Feed
- Permalink
- Report Inappropriate Content
Count/distinct over time
I am working on counting how many times the promise date for an order changed over time. The pivot table I made looks like this:\\\
| Order | 3/2/2015 | 3/3/2015 | 3/4/2015 |
|---|---|---|---|
| 2312323 | 5/3/2015 | 5/6/2015 | 5/10/2015 |
| 1234324 | 6/3/2015 | 6/3/2015 | 6/3/2015 |
| 5678901 | 4/16/2015 | 4/19/2015 | 4/16/2015 |
The dates in the data cells are the promise dates. My question is if there's a way of counting how many times each order's promise dates changed during the life of the order? Currently I am using Count(Distinct()) but in a case like Order #5678901, it would only count that it changed once because it went back to the same promise date.
This is my current expression in the table where I am counting: if((count(distinct([Promise Date]))-1)>=0,(count(distinct([Promise Date]))-1),'-')
The results I would want in this example would be:
Order, # of Changes
2312323, 2
1234324,0
5678901,2
I'm not sure if this is possible but I would appreciate any help I can get.
- « Previous Replies
- Next Replies »
Accepted Solutions
- Mark as New
- Bookmark
- Subscribe
- Mute
- Subscribe to RSS Feed
- Permalink
- Report Inappropriate Content
Hi Alex,
Script will look somehow like this. (Adding the piece of code suggested by maxgro
[Aged Orders - March_temp]:
LOAD Date(Date#(Mid(FileName(),6,6),'MMDDYY')) as Date,
//Above line is for pulling date from file name
[Sales Doc.],
Item,
Upper(Status) as Status,
[Promise Date],
[Sales Doc.] & Item as [Order], bla bla... FROM bla bla
;
[Aged Orders - March]
load *,
if(Order=Peek(Order) and [Promise Date]<>peek([Promise Date]), 1, 0) as FlagChanged
Resident [Aged Orders - March_temp]
order by Order, Date;
drop Table [Aged Orders - March_temp];
After Reloading the script,
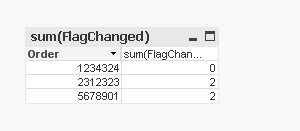
Add the expression 'sum(FlagChanged) ' to your pivot table.
Note : Premise is not a qlikview function, its a field name used here.
Thanks
krishna
- Mark as New
- Bookmark
- Subscribe
- Mute
- Subscribe to RSS Feed
- Permalink
- Report Inappropriate Content
maybe in the script
a:
load * inline [
Order, Date, Premise
2312323, 3/2/2015, 5/3/2015
2312323, 3/3/2015, 5/6/2015
2312323, 3/4/2015, 5/10/2015
1234324, 3/2/2015, 6/3/2015,
1234324, 3/3/2015, 6/3/2015
1234324, 3/4/2015, 6/3/2015
5678901, 3/2/2015, 4/16/2015
5678901, 3/3/2015, 4/19/2015
5678901, 3/4/2015, 4/16/2015
];
f:
load *, if(Order=Peek(Order) and Premise<>peek(Premise), 1, 0) as FlagChanged
Resident a
order by Order, Date;
drop Table a;
then the chart is just a sum(FlagChanged)
- Mark as New
- Bookmark
- Subscribe
- Mute
- Subscribe to RSS Feed
- Permalink
- Report Inappropriate Content
Maybe you could include another field to make promise date unique:
count(distinct [Promise Date]&[Another Field])
If not you will need some within the script, maybe a rowno() or calculate it directly within an ordered resident-load with peek() or previous(): Peek() vs Previous() – When to Use Each
- Marcus
- Mark as New
- Bookmark
- Subscribe
- Mute
- Subscribe to RSS Feed
- Permalink
- Report Inappropriate Content
I can't make an inline table like that in the script though, mainly because this data in my pivot table is being pulled from many files and has thousands of orders in each file. The table I created in this discussion pretty much just outlines what I am looking at for data. Sorry I didn't make that clear! So I'm not sure if I can do the rest of your suggestion.
- Mark as New
- Bookmark
- Subscribe
- Mute
- Subscribe to RSS Feed
- Permalink
- Report Inappropriate Content
The Inline from maxgro was also just an example. You could simply use your table-load - maybe you need to load them twice if your table isn't ordered properly for the peek()-function.
- Marcus
- Mark as New
- Bookmark
- Subscribe
- Mute
- Subscribe to RSS Feed
- Permalink
- Report Inappropriate Content
All of the files I am loading look more like:
[Aged Orders - March]:
LOAD Date(Date#(Mid(FileName(),6,6),'MMDDYY')) as Date,
//Above line is for pulling date from file name
[Sales Doc.],
Item,
Upper(Status) as Status,
[Promise Date],
[Sales Doc.] & Item as [Order],
Since the Date is created from an expression in the script, can you still use Peek and Premise like maxgro suggested? I'm just confused on how to use Peek, Previous, Premise, etc.
Anyway, the pivot table was created from the Date and Order fields, with the Promise Date in the data cells.
- Mark as New
- Bookmark
- Subscribe
- Mute
- Subscribe to RSS Feed
- Permalink
- Report Inappropriate Content
Hi Alex,
Script will look somehow like this. (Adding the piece of code suggested by maxgro
[Aged Orders - March_temp]:
LOAD Date(Date#(Mid(FileName(),6,6),'MMDDYY')) as Date,
//Above line is for pulling date from file name
[Sales Doc.],
Item,
Upper(Status) as Status,
[Promise Date],
[Sales Doc.] & Item as [Order], bla bla... FROM bla bla
;
[Aged Orders - March]
load *,
if(Order=Peek(Order) and [Promise Date]<>peek([Promise Date]), 1, 0) as FlagChanged
Resident [Aged Orders - March_temp]
order by Order, Date;
drop Table [Aged Orders - March_temp];
After Reloading the script,
Add the expression 'sum(FlagChanged) ' to your pivot table.
Note : Premise is not a qlikview function, its a field name used here.
Thanks
krishna
- Mark as New
- Bookmark
- Subscribe
- Mute
- Subscribe to RSS Feed
- Permalink
- Report Inappropriate Content
So I load both of those right? The [Aged Orders - March]_temp and the second one as well?
- Mark as New
- Bookmark
- Subscribe
- Mute
- Subscribe to RSS Feed
- Permalink
- Report Inappropriate Content
[Aged Orders - March]
load *,
if(Order=Peek(Order) and [Promise Date]<>peek([Promise Date]), 1, 0) as FlagChanged
Resident [Aged Orders - March]_temp
order by Order, Date; //until here,it pulls fields from the temp table and performs the if() stmnt condition
drop Table [Aged Orders - March]_temp; //this piece drops the temp table from memory.
By writing the above script you will be loading only one table [Aged Orders - March].
- Mark as New
- Bookmark
- Subscribe
- Mute
- Subscribe to RSS Feed
- Permalink
- Report Inappropriate Content
If the above confuses you,Just Add
load *,
if(Order=Peek(Order) and [Promise Date]<>peek([Promise Date]), 1, 0) as FlagChanged;
above your existing script and reload.
[Aged Orders - March]:
load *,
if(Order=Peek(Order) and [Promise Date]<>peek([Promise Date]), 1, 0) as FlagChanged;
LOAD Date(Date#(Mid(FileName(),6,6),'MMDDYY')) as Date,
//Above line is for pulling date from file name
[Sales Doc.],
Item,
Upper(Status) as Status,
[Promise Date],
[Sales Doc.] & Item as [Order], bla bla... FROM bla bla
- « Previous Replies
- Next Replies »