Unlock a world of possibilities! Login now and discover the exclusive benefits awaiting you.
- Qlik Community
- :
- All Forums
- :
- QlikView App Dev
- :
- Count if the Occurrence is not in Multiple state
- Subscribe to RSS Feed
- Mark Topic as New
- Mark Topic as Read
- Float this Topic for Current User
- Bookmark
- Subscribe
- Mute
- Printer Friendly Page
- Mark as New
- Bookmark
- Subscribe
- Mute
- Subscribe to RSS Feed
- Permalink
- Report Inappropriate Content
Count if the Occurrence is not in Multiple state
Hi Friends,
I have a data with Computer Name, Installation Status, Health State. Some computers will have the status as INSTALLED and not FAILED. But some computers will have both INSTALLED and FAILED.
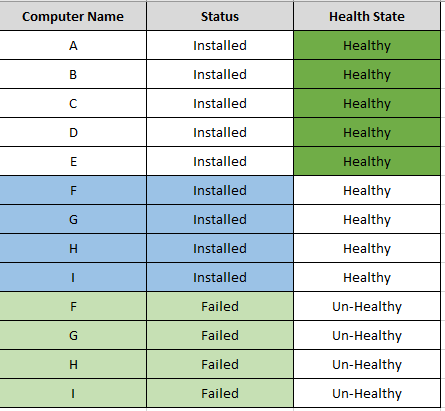
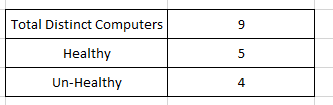
I would like to create a table for Health State as below. If you look at the below result the total computers is 9 (distinct). But 5 computers are a member of Installed status only. I already have a similar report in Tableau. But now we are moving on to QlikView from Tableau. I dont know how to achieve this in QlikView.
- « Previous Replies
-
- 1
- 2
- Next Replies »
- Mark as New
- Bookmark
- Subscribe
- Mute
- Subscribe to RSS Feed
- Permalink
- Report Inappropriate Content
May be like this (assuming all the above your mentioned are un-healthy)
Dimension
If(Match(Status, 'Failed', 'Not Installed', 'Downloaded'), 'Un-Healthy', 'Healthy')
Expression
=Count(DISTINCT {<[Computer Name] = e({<Status = {'Failed', 'Not Installed', 'Downloaded'}>})>+<Status = {'Failed', 'Not Installed', 'Downloaded'}>} [Computer Name])
- Mark as New
- Bookmark
- Subscribe
- Mute
- Subscribe to RSS Feed
- Permalink
- Report Inappropriate Content
create that 3 field in script buddy 
If a post helps to resolve your issue, please accept it as a Solution.
- Mark as New
- Bookmark
- Subscribe
- Mute
- Subscribe to RSS Feed
- Permalink
- Report Inappropriate Content
If you have a lot of field values belonging to unhealthy and these may change over time, focus on healthy / installed instead:
| =If(Status='Installed','Healthy','Unhealthy') | =Count(DISTINCT {<[Computer Name] = e({<Status -= {'Installed'}>})>+<Status -= {'Installed'}>} [Computer Name]) |
|---|---|
| 9 | |
| Healthy | 5 |
| Unhealthy | 4 |
- Mark as New
- Bookmark
- Subscribe
- Mute
- Subscribe to RSS Feed
- Permalink
- Report Inappropriate Content
Thanks Sunny. Completed the report with your valuable suggestions. Thanks to all suggestions from others.
- « Previous Replies
-
- 1
- 2
- Next Replies »