Unlock a world of possibilities! Login now and discover the exclusive benefits awaiting you.
- Qlik Community
- :
- All Forums
- :
- QlikView App Dev
- :
- Count month wise
- Subscribe to RSS Feed
- Mark Topic as New
- Mark Topic as Read
- Float this Topic for Current User
- Bookmark
- Subscribe
- Mute
- Printer Friendly Page
- Mark as New
- Bookmark
- Subscribe
- Mute
- Subscribe to RSS Feed
- Permalink
- Report Inappropriate Content
Count month wise
Hi all,
Please help me out
i have two tables Table1 and Table2. In the table 1 showing the count of case in month wise and details are available in table2. I want to take count of Incident from table 2 and add the count in table1 month wise. This will happen dynamic it means when new month is came into the Table2 then new month incident count will add in the table1.
condition is when incident status is open then i have to count in every month.
ex:- incident 1001 is available in jan so Jan count is 1 and next month again status is open so counting is 1 and in the march month new incident is came so count is showing 2.
Please let me know if required more explanation.
Table1
Month | Count of case |
Jan | 1 |
Feb | 1 |
Mar | 2 |
Table2
Incident | Status | Date |
1001 | Open | Jan 30, 2015 10:44:14 PM |
1001 | Open | Jan 30, 2015 10:44:19 PM |
1001 | Open | Feb 2, 2015 2:18:51 AM |
1001 | Open | Feb 2, 2015 2:18:53 AM |
1001 | Open | Mar 23, 2015 7:05:18 AM |
1001 | Open | Mar 23, 2015 7:05:33 AM |
1002 | Open | Mar 29, 2015 7:00:07 PM |
Best Regards
Balram
- Mark as New
- Bookmark
- Subscribe
- Mute
- Subscribe to RSS Feed
- Permalink
- Report Inappropriate Content
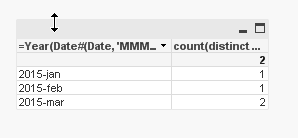
chart
you can make a chart with
dimension Year(Date#(Date, 'MMM D, YYYY h:mm:ss tt')) & '-' & Month(Date#(Date, 'MMM D, YYYY h:mm:ss tt'))
expression count(distinct Incident)
script
Table2:
LOAD Incident,
Status,
Date
FROM
[https://community.qlik.com/thread/179338]
(html, codepage is 1252, embedded labels, table is @2);
- Mark as New
- Bookmark
- Subscribe
- Mute
- Subscribe to RSS Feed
- Permalink
- Report Inappropriate Content
Hi Massimo,
Thanks for your reply.This solution is helpful for me.
could you please tell me how can i show this solution for only 12 rolling months, it means when i click one month then it will show current month data and previous 11 month data.
Thanks and Regards
Balram
- Mark as New
- Bookmark
- Subscribe
- Mute
- Subscribe to RSS Feed
- Permalink
- Report Inappropriate Content
PFA