Unlock a world of possibilities! Login now and discover the exclusive benefits awaiting you.
- Qlik Community
- :
- All Forums
- :
- QlikView App Dev
- :
- Countif for positive and negative numbers in a dim...
- Subscribe to RSS Feed
- Mark Topic as New
- Mark Topic as Read
- Float this Topic for Current User
- Bookmark
- Subscribe
- Mute
- Printer Friendly Page
- Mark as New
- Bookmark
- Subscribe
- Mute
- Subscribe to RSS Feed
- Permalink
- Report Inappropriate Content
Countif for positive and negative numbers in a dimension...
Hi. I am very new to Qlikview and a little stuck.
In MS Excel, I would use, "countif("A:A",">0")
I am trying to count how many items in a column are greater than 0 and how many are less than 0 and represent this as a separate calculated dimension.
Can anyone help?
Thank you.
Regards,
Bill.
- Tags:
- new_to_qlikview
Accepted Solutions
- Mark as New
- Bookmark
- Subscribe
- Mute
- Subscribe to RSS Feed
- Permalink
- Report Inappropriate Content
Bill,
Is "Price Change" the name of a field? Does the field Value exist in your data model? Try with
Count({< [Price Change] = {'>0'} >} [Price Change])
Sorry for the misleading. In my example above, "Value" is not a keyword, it is a field name. When the chart is fully expanded, as in your screenshot, the Count() should return 1 or 0, but the totals should return all right.
Hope that makes more sense now.
Miguel
- Mark as New
- Bookmark
- Subscribe
- Mute
- Subscribe to RSS Feed
- Permalink
- Report Inappropriate Content
Hi Bill,
If that is in a chart, set your expression to
Count({< Value = {'>0'} >} FieldName)
Hope that helps.
Miguel
- Mark as New
- Bookmark
- Subscribe
- Mute
- Subscribe to RSS Feed
- Permalink
- Report Inappropriate Content
Hi Miguel.
Qlikview is counting even when the value in the Price Change column is 0.![]()
I need to split out how many are above 0 and how many are below 0.
Did I miss something?
- Mark as New
- Bookmark
- Subscribe
- Mute
- Subscribe to RSS Feed
- Permalink
- Report Inappropriate Content
Hi Bill,
First, what type of chart are you using? Second, is that value in each row or that zero is the result of a previous expression?
Regards.
Miguel
- Mark as New
- Bookmark
- Subscribe
- Mute
- Subscribe to RSS Feed
- Permalink
- Report Inappropriate Content
The chart type is a pivot table.
The values are in each row.
- Mark as New
- Bookmark
- Subscribe
- Mute
- Subscribe to RSS Feed
- Permalink
- Report Inappropriate Content
Bill,
Perhaps you can share some data so we can try ourselves. That expression should work just fine. It will return 1 or 0 for each row, but the total should be correct. If you are looking for null values or values that depend on another expression, then that will not work, since the actual value is not zero or is a result of a different calculation.
Hope that helps.
Miguel
- Mark as New
- Bookmark
- Subscribe
- Mute
- Subscribe to RSS Feed
- Permalink
- Report Inappropriate Content
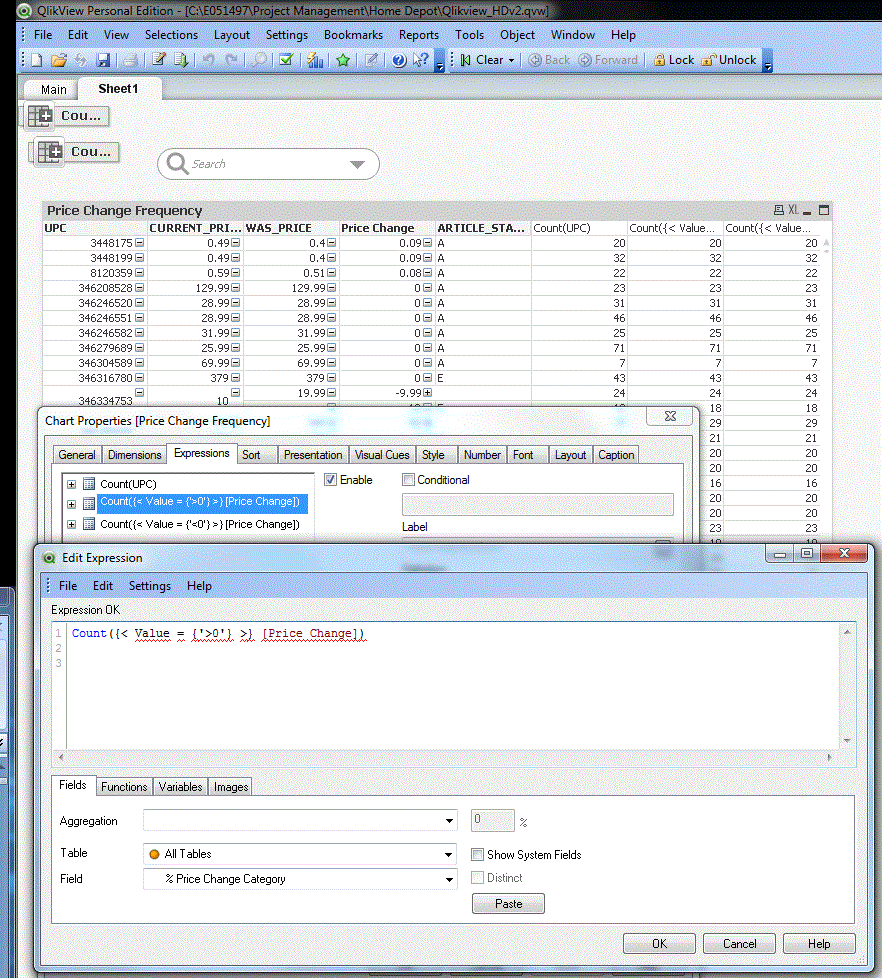
Unfortunately, I only have the Personal version, so I can't export anything.
Best I can do is a screenshot...
The calculated dimensions are showing up, but no distinction is being made between when the values are positive values, negative values or zeroes...??
I appreciate any help. Sorry for the trouble.
I'll check in tomorrow. I have to head home at the moment.
Regards,
Bill.
- Mark as New
- Bookmark
- Subscribe
- Mute
- Subscribe to RSS Feed
- Permalink
- Report Inappropriate Content
Bill,
Is "Price Change" the name of a field? Does the field Value exist in your data model? Try with
Count({< [Price Change] = {'>0'} >} [Price Change])
Sorry for the misleading. In my example above, "Value" is not a keyword, it is a field name. When the chart is fully expanded, as in your screenshot, the Count() should return 1 or 0, but the totals should return all right.
Hope that makes more sense now.
Miguel
- Mark as New
- Bookmark
- Subscribe
- Mute
- Subscribe to RSS Feed
- Permalink
- Report Inappropriate Content
That did it! It works perfectly now.
Thanks for the quick responses. I really appreciate the help.
Regards,
Bill Robbins.