Unlock a world of possibilities! Login now and discover the exclusive benefits awaiting you.
- Qlik Community
- :
- All Forums
- :
- QlikView App Dev
- :
- Counting number of occurences of day of week in la...
- Subscribe to RSS Feed
- Mark Topic as New
- Mark Topic as Read
- Float this Topic for Current User
- Bookmark
- Subscribe
- Mute
- Printer Friendly Page
- Mark as New
- Bookmark
- Subscribe
- Mute
- Subscribe to RSS Feed
- Permalink
- Report Inappropriate Content
Counting number of occurences of day of week in last 7 days
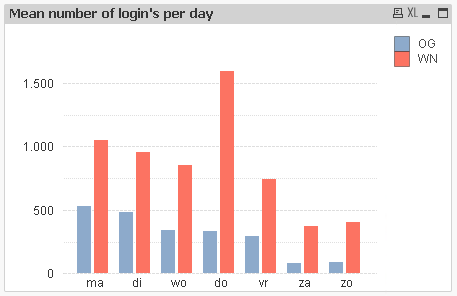
I have a dataset containing all the login dates of users during the last 364 days (52 x 7). The field name is Start and is a datetime value.
I am using a Bar Chart to display the mean value of logins on a specific day a week. The used dimension is WeekDay(Start).
I have two expressions:
Count({$<DefaultOgId={">0"}>}Start)/52
Count({$<DefaultWnId={">0"}>}Start)/52
This works fine (see attached capture.png), but now I want to add two extra expressions that only show the number of logins in the last 7 days of the dataset. So I can see the most recent counts alongside the mean value on that day during the last year.
I cannot figure out how to make that work!
This does not work: Count({$<DefaultWnId={">0"},Start={">=$(=Today()-6)"}>}Start)
Accepted Solutions
- Mark as New
- Bookmark
- Subscribe
- Mute
- Subscribe to RSS Feed
- Permalink
- Report Inappropriate Content
It seems to work like this:
=Sum({$<DefaultOgId={">0"}>}if(Start>ToDay()-6,1,0))
- Mark as New
- Bookmark
- Subscribe
- Mute
- Subscribe to RSS Feed
- Permalink
- Report Inappropriate Content
can you test :
Count({$<DefaultWnId={">0"},Start={">=$(=Date(Today()-6))"}>}Start)Taoufiq ZARRA
"Please LIKE posts and "Accept as Solution" if the provided solution is helpful "
(you can mark up to 3 "solutions") 😉
- Mark as New
- Bookmark
- Subscribe
- Mute
- Subscribe to RSS Feed
- Permalink
- Report Inappropriate Content
Hello Taoufiq,
I just tried. There is no error but it results in no values.
There are however login values for the last week in the dataset.
- Mark as New
- Bookmark
- Subscribe
- Mute
- Subscribe to RSS Feed
- Permalink
- Report Inappropriate Content
It seems to work like this:
=Sum({$<DefaultOgId={">0"}>}if(Start>ToDay()-6,1,0))
- Mark as New
- Bookmark
- Subscribe
- Mute
- Subscribe to RSS Feed
- Permalink
- Report Inappropriate Content
It appears you got things sorted, I am going to mark your last post as the solution given you confirmed that worked. I just wanted to pass along some other potentially useful info. Here is a specific Design Blog link related to dates in set analysis that may be useful, and below that is the base URL to the Design Blog area in case you want to search further now or in the future. There are hundreds of how-to related posts in this area from our experts, so should be helpful when looking for ideas on how to approach different topics.
https://community.qlik.com/t5/Qlik-Design-Blog/Dates-in-Set-Analysis/ba-p/1472511
https://community.qlik.com/t5/Qlik-Design-Blog/bg-p/qlik-design-blog
Regards,
Brett
I now work a compressed schedule, Tuesday, Wednesday and Thursday, so those will be the days I will reply to any follow-up posts.