Unlock a world of possibilities! Login now and discover the exclusive benefits awaiting you.
- Qlik Community
- :
- All Forums
- :
- QlikView App Dev
- :
- Re: Counting with Set Analysis
- Subscribe to RSS Feed
- Mark Topic as New
- Mark Topic as Read
- Float this Topic for Current User
- Bookmark
- Subscribe
- Mute
- Printer Friendly Page
- Mark as New
- Bookmark
- Subscribe
- Mute
- Subscribe to RSS Feed
- Permalink
- Report Inappropriate Content
Counting with Set Analysis
I need some help with counting in an expression.
My data set looks like this:
| Account | Date | ProcedureChargeCategory | TransactionProcedureID | Amount |
| R456789 | 1/1/2014 | 120 | 120004 | 500 |
| R456789 | 1/2/2014 | 120 | 120004 | 500 |
| R456789 | 1/3/2014 | 120 | 120004 | 500 |
| R456789 | 1/4/2014 | 120 | 120004 | 500 |
| R456789 | 1/5/2014 | 120 | 120004 | 500 |
| R456789 | 1/5/2014 | 120 | 120004 | -500 |
On 1/5/2014, the item was charged in error, and reversed, resulting in a zero amount for that day. I need to count the number of charges that were not reversed. In this case, the correct count = 3, not 5.
The only items I want to count are those where ProcedureChargeCategory<250, so I can count the total using this expression:
if(ProcedureChargeCategory<250,count(ProcedureChargeCategory))
But I'm at a loss as to how to account for the reversed charge to arrive at the correct total. I'm guessing it's a set analysis problem, which is definitely not my strong suit.
How would you solve this problem?
- « Previous Replies
-
- 1
- 2
- Next Replies »
Accepted Solutions
- Mark as New
- Bookmark
- Subscribe
- Mute
- Subscribe to RSS Feed
- Permalink
- Report Inappropriate Content
Probably my bad. I changed something at the last sec and probably forgot to upload with the changes in.
To show the count only where the code is < 250 the formula is a bit simpler.
if( ProcedureChargeCategory<250,
count( distinct RecordNumber)
-
count( distinct if( Amount < 0, RecordNumber))*2
)
- Mark as New
- Bookmark
- Subscribe
- Mute
- Subscribe to RSS Feed
- Permalink
- Report Inappropriate Content
Hi Sam,
Hows the count=3 and not 5??
Regards
KC
KC
- Mark as New
- Bookmark
- Subscribe
- Mute
- Subscribe to RSS Feed
- Permalink
- Report Inappropriate Content
Hi, KC.
It's 3 because the two entries on 1/5/2014 cancel each other out. Basically, the item was charged in error, and reversed.
- Mark as New
- Bookmark
- Subscribe
- Mute
- Subscribe to RSS Feed
- Permalink
- Report Inappropriate Content
Still we have a count of 4 ? Can you explain a bit more about your requirement?
REgards
KC
KC
- Mark as New
- Bookmark
- Subscribe
- Mute
- Subscribe to RSS Feed
- Permalink
- Report Inappropriate Content
I think you want 4 records in this case
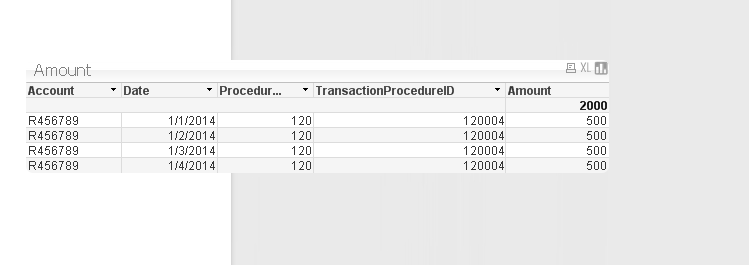
In this chart I used the following formula for Amount. It checks for procedurechargecategories and the total for that date.
Note that if the charge was debited and creditted on the same day, the total for that day is 0. Is that a good assumption ?
You may also need to total on more dimensions than <Date> in your actual data set but this works for the sample. Post a longer sample if you need to get further clarification
if( sum( total <Date> if(ProcedureChargeCategory<250, Amount)) <> 0 , sum( if(ProcedureChargeCategory<250, Amount) ))
- Mark as New
- Bookmark
- Subscribe
- Mute
- Subscribe to RSS Feed
- Permalink
- Report Inappropriate Content
Hi again, Jonathan.
Yes, you're both correct. The answer should be 4, not 3. Don't you love it when the accountant fails at basic arithmetic?
In your expression, the sum of Amount is correct. But what I need is a Count. I tried changing the second IF to COUNT, but I get 6, not 4.
- Mark as New
- Bookmark
- Subscribe
- Mute
- Subscribe to RSS Feed
- Permalink
- Report Inappropriate Content
Try getting the count in a textbox.
if( sum( total <Date> if(ProcedureChargeCategory<250, Amount)) <> 0 , count(distinct if(ProcedureChargeCategory<250, Amount) ))
Regards
KC
KC
- Mark as New
- Bookmark
- Subscribe
- Mute
- Subscribe to RSS Feed
- Permalink
- Report Inappropriate Content
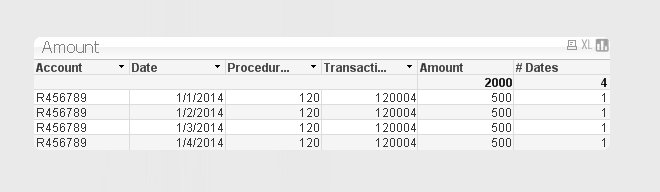
For count i added this expression into the same chart.
if( sum( total <Date> if(ProcedureChargeCategory<250, Amount)) <> 0 and ProcedureChargeCategory<250, 1)
Then on the total's , change it from "expression total" to 'Sum of Rows"
- Mark as New
- Bookmark
- Subscribe
- Mute
- Subscribe to RSS Feed
- Permalink
- Report Inappropriate Content
Try getting grand total in a text box,that will be more meaningful. Just a suggestion  .Above one is good
Regards
KC
KC
- Mark as New
- Bookmark
- Subscribe
- Mute
- Subscribe to RSS Feed
- Permalink
- Report Inappropriate Content
Jonathan:
I left out an important piece of the puzzle here. The table I posted is my data model. My chart (a straight table) needs to look like this:
| Account | ProcedureChargeCategory | Count |
| R456789 | 120 | 4 |
| R456789 | 250 | |
| R456789 | 362 | |
| R456789 | 985 | |
| R678910 | 122 | 2 |
| R678910 | 255 | |
| R678910 | 621 |
The only lines that have a value in the Count column are those with a ProcedureChargeCategory < 250. The rest would be either blank or 0. So, the accumulation happens in the chart expression.
- « Previous Replies
-
- 1
- 2
- Next Replies »