Unlock a world of possibilities! Login now and discover the exclusive benefits awaiting you.
- Qlik Community
- :
- All Forums
- :
- QlikView App Dev
- :
- Re: Create a Flag
- Subscribe to RSS Feed
- Mark Topic as New
- Mark Topic as Read
- Float this Topic for Current User
- Bookmark
- Subscribe
- Mute
- Printer Friendly Page
- Mark as New
- Bookmark
- Subscribe
- Mute
- Subscribe to RSS Feed
- Permalink
- Report Inappropriate Content
Create a Flag
T1:
| Id | Name | Status | Risk | Date |
| 100 | ABC | Open | Low | 10/1/2014 |
| 100 | ABC | Closed | Medium | 3/2/2014 |
| 200 | DEF | Open | Low | 1/1/2015 |
| 200 | DEF | Open | Medium | 1/2/2015 |
| 200 | DEF | Closed | High | 1/3/2015 |
| 300 | XXX | Open | High | 5/6/2015 |
| 300 | XXX | Open | Low | 7/7/2015 |
| 300 | XXX | Closed | High | 8/9/2015 |
| 400 | YYY | Open | Low | 1/2/2015 |
| 400 | YYY | Closed | Medium | 2/2/2015 |
| 500 | ZZZ | Open | Low | 2/3/2015 |
| 100 | ABC | Closed | High | 3/5/2014 |
| 100 | ABC | Closed | Medium | 3/3/2014 |
| 200 | DEF | Closed | Low | 1/4/2015 |
I have a Table T1 with above mentioned data
we need to show the Risk for a Id changes from when we first receive the Id's risk in the above table to when their Status changes to Closed
A flag needs to be added to know risk changes or not
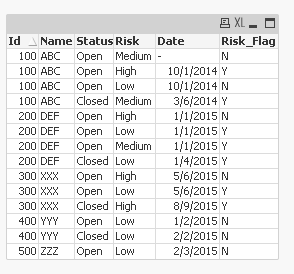
Output:
| Id | Name | Status | Risk | Date | Risk_Flag |
| 100 | ABC | Open | Low | 10/1/2014 | N |
| 100 | ABC | Open | Medium | 3/2/2014 | Y |
| 100 | ABC | Open | High | 3/5/2014 | Y |
| 100 | ABC | Closed | Medium | 3/6/2014 | Y |
| 200 | DEF | Open | Low | 1/1/2015 | N |
| 200 | DEF | Open | Medium | 1/2/2015 | Y |
| 200 | DEF | Open | High | 1/3/2015 | Y |
| 200 | DEF | Closed | Low | 1/4/2015 | Y |
| 300 | XXX | Open | High | 5/6/2015 | N |
| 300 | XXX | Open | Low | 7/7/2015 | Y |
| 300 | XXX | Closed | High | 8/9/2015 | Y |
| 400 | YYY | Open | Low | 1/2/2015 | N |
| 400 | YYY | Closed | Medium | 2/2/2015 | Y |
| 500 | ZZZ | Open | Low | 2/3/2015 | N |
Please help me to get the above output.
- Mark as New
- Bookmark
- Subscribe
- Mute
- Subscribe to RSS Feed
- Permalink
- Report Inappropriate Content
No it is not working for the same logic as dates have been changed
- Mark as New
- Bookmark
- Subscribe
- Mute
- Subscribe to RSS Feed
- Permalink
- Report Inappropriate Content
what would be the expected output for this
- Mark as New
- Bookmark
- Subscribe
- Mute
- Subscribe to RSS Feed
- Permalink
- Report Inappropriate Content
kush141087 your logic is working perfectly according to the requirement.
- Mark as New
- Bookmark
- Subscribe
- Mute
- Subscribe to RSS Feed
- Permalink
- Report Inappropriate Content
Or just do order by ID
- Mark as New
- Bookmark
- Subscribe
- Mute
- Subscribe to RSS Feed
- Permalink
- Report Inappropriate Content
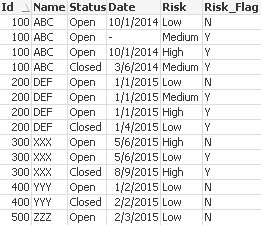
Data:
| Id | Name | Status | Risk | Date |
| 100 | ABC | Open | Low | 10/1/2014 |
| 100 | ABC | Open | Medium | - |
| 200 | DEF | Open | Low | 1/1/2015 |
| 200 | DEF | Open | Medium | 1/1/2015 |
| 200 | DEF | Open | High | 1/1/2015 |
| 300 | XXX | Open | High | 5/6/2015 |
| 300 | XXX | Open | Low | 5/6/2015 |
| 300 | XXX | Closed | High | 8/9/2015 |
| 400 | YYY | Open | Low | 1/2/2015 |
| 400 | YYY | Closed | Low | 2/2/2015 |
| 500 | ZZZ | Open | Low | 2/3/2015 |
| 100 | ABC | Open | High | 10/1/2014 |
| 100 | ABC | Closed | Medium | 3/6/2014 |
| 200 | DEF | Closed | Low | 1/4/2015 |
Result:
| Id | Name | Status | Risk | Date | Risk_Flag |
| 100 | ABC | Open | Low | 10/1/2014 | N |
| 100 | ABC | Open | Medium | - | Y |
| 100 | ABC | Open | High | 10/1/2014 | Y |
| 100 | ABC | Closed | Medium | 3/6/2014 | Y |
| 200 | DEF | Open | Low | 1/1/2015 | N |
| 200 | DEF | Open | Medium | 1/1/2015 | Y |
| 200 | DEF | Open | High | 1/1/2015 | Y |
| 200 | DEF | Closed | Low | 1/4/2015 | Y |
| 300 | XXX | Open | High | 5/6/2015 | N |
| 300 | XXX | Open | Low | 5/6/2015 | Y |
| 300 | XXX | Closed | High | 8/9/2015 | Y |
| 400 | YYY | Open | Low | 1/2/2015 | N |
| 400 | YYY | Closed | Low | 2/2/2015 | N |
| 500 | ZZZ | Open | Low | 2/3/2015 | N |
- Mark as New
- Bookmark
- Subscribe
- Mute
- Subscribe to RSS Feed
- Permalink
- Report Inappropriate Content
What output you are getting using the logic I have suggested.. can you show?
- Mark as New
- Bookmark
- Subscribe
- Mute
- Subscribe to RSS Feed
- Permalink
- Report Inappropriate Content
Kush this
- Mark as New
- Bookmark
- Subscribe
- Mute
- Subscribe to RSS Feed
- Permalink
- Report Inappropriate Content
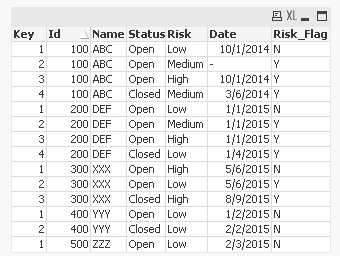
Try this:
Table:
LOAD Id,
Name,
Status,
Risk,
Date,
AutoNumber(RowNo(), Id) as Key
FROM
[https://community.qlik.com/thread/216412]
(html, codepage is 1252, embedded labels, table is @17);
FinalTable:
LOAD *,
If(Id = Peek('Id'), If(Risk <> Peek('Risk'), 'Y', 'N'), 'N') as Risk_Flag
Resident Table
Order By Id, Key;
DROP Table Table;
- Mark as New
- Bookmark
- Subscribe
- Mute
- Subscribe to RSS Feed
- Permalink
- Report Inappropriate Content
see this
Data:
LOAD Id,
Name,
Status,
Risk,
Date,
RecNo() as Rec
FROM
[https://community.qlik.com/thread/216412]
(html, codepage is 1252, embedded labels, table is @17);
Final:
LOAD Id,
Rec,
if(Id <> previous(Id) or (Id = previous(Id) and Risk= previous(Risk)),'N','Y') as Risk_Flag,
Name,
Status,
Risk,
Date
Resident Data
order by Id,Rec;
- Mark as New
- Bookmark
- Subscribe
- Mute
- Subscribe to RSS Feed
- Permalink
- Report Inappropriate Content
| ID | Fixed | Status | Test_Date | values | Date |
| 100 | N | approved | 8/8/2016 | Text | 8/8/2016 |
| 200 | N | approved | 26/05/2016 | Text1 | 26/05/2016 |
| 300 | N | approved | 27/05/2016 | Text1 | 27/05/2016 |
| 400 | N | approved | 10/10/2016 | Text1 | 10/10/2016 |
| 500 | N | Reject | 10/12/2016 | Text4 | 10/12/2016 |
| 500 | Y | Reject | 10/12/2016 | Text4 | 10/13/2016 |
three bar charts can be displayed on below 3 conditions
1)Where Status = approved
Fixed = 'N'
today date is greater than the Test_Date-60 (bar chart)
2)Where status = approved
Fixed = 'N'
today date is is greater than the Test_Date (bar chart)
3)Where Satus = Reject
Match where the role has Text4 (bar chart)
Could you please help on above three set expressions.